Scorecard
The Scorecard feature in APEX Project Eye offers a comprehensive way to evaluate and measure the size and complexity of your Oracle APEX applications. This powerful analytical tool provides developers, project managers, and organizations with valuable metrics to better understand their application architecture and make informed decisions regarding maintenance, refactoring, and resource allocation.
Key Benefits
Section titled “Key Benefits”- Application Complexity Assessment: Quantify application complexity with objective metrics, helping you identify areas that might require refactoring or special attention
- Page-Level Evaluation: Drill down to individual page complexity scores to identify potential bottlenecks or maintenance challenges
- Visualization Tools: View complexity data through intuitive bubble charts and gauges for easy interpretation
- Performance Optimization: Identify overly complex pages that might benefit from performance improvements
- Resource Planning: Use complexity scores to better estimate maintenance or migration efforts and resource requirements
How It Works
Section titled “How It Works”The Scorecard feature analyzes your APEX applications and calculates complexity scores based on multiple factors including:
- Number of regions, items, and other components
- JavaScript and PL/SQL code complexity
- Page interactions and dependencies
- Dynamic actions and processes
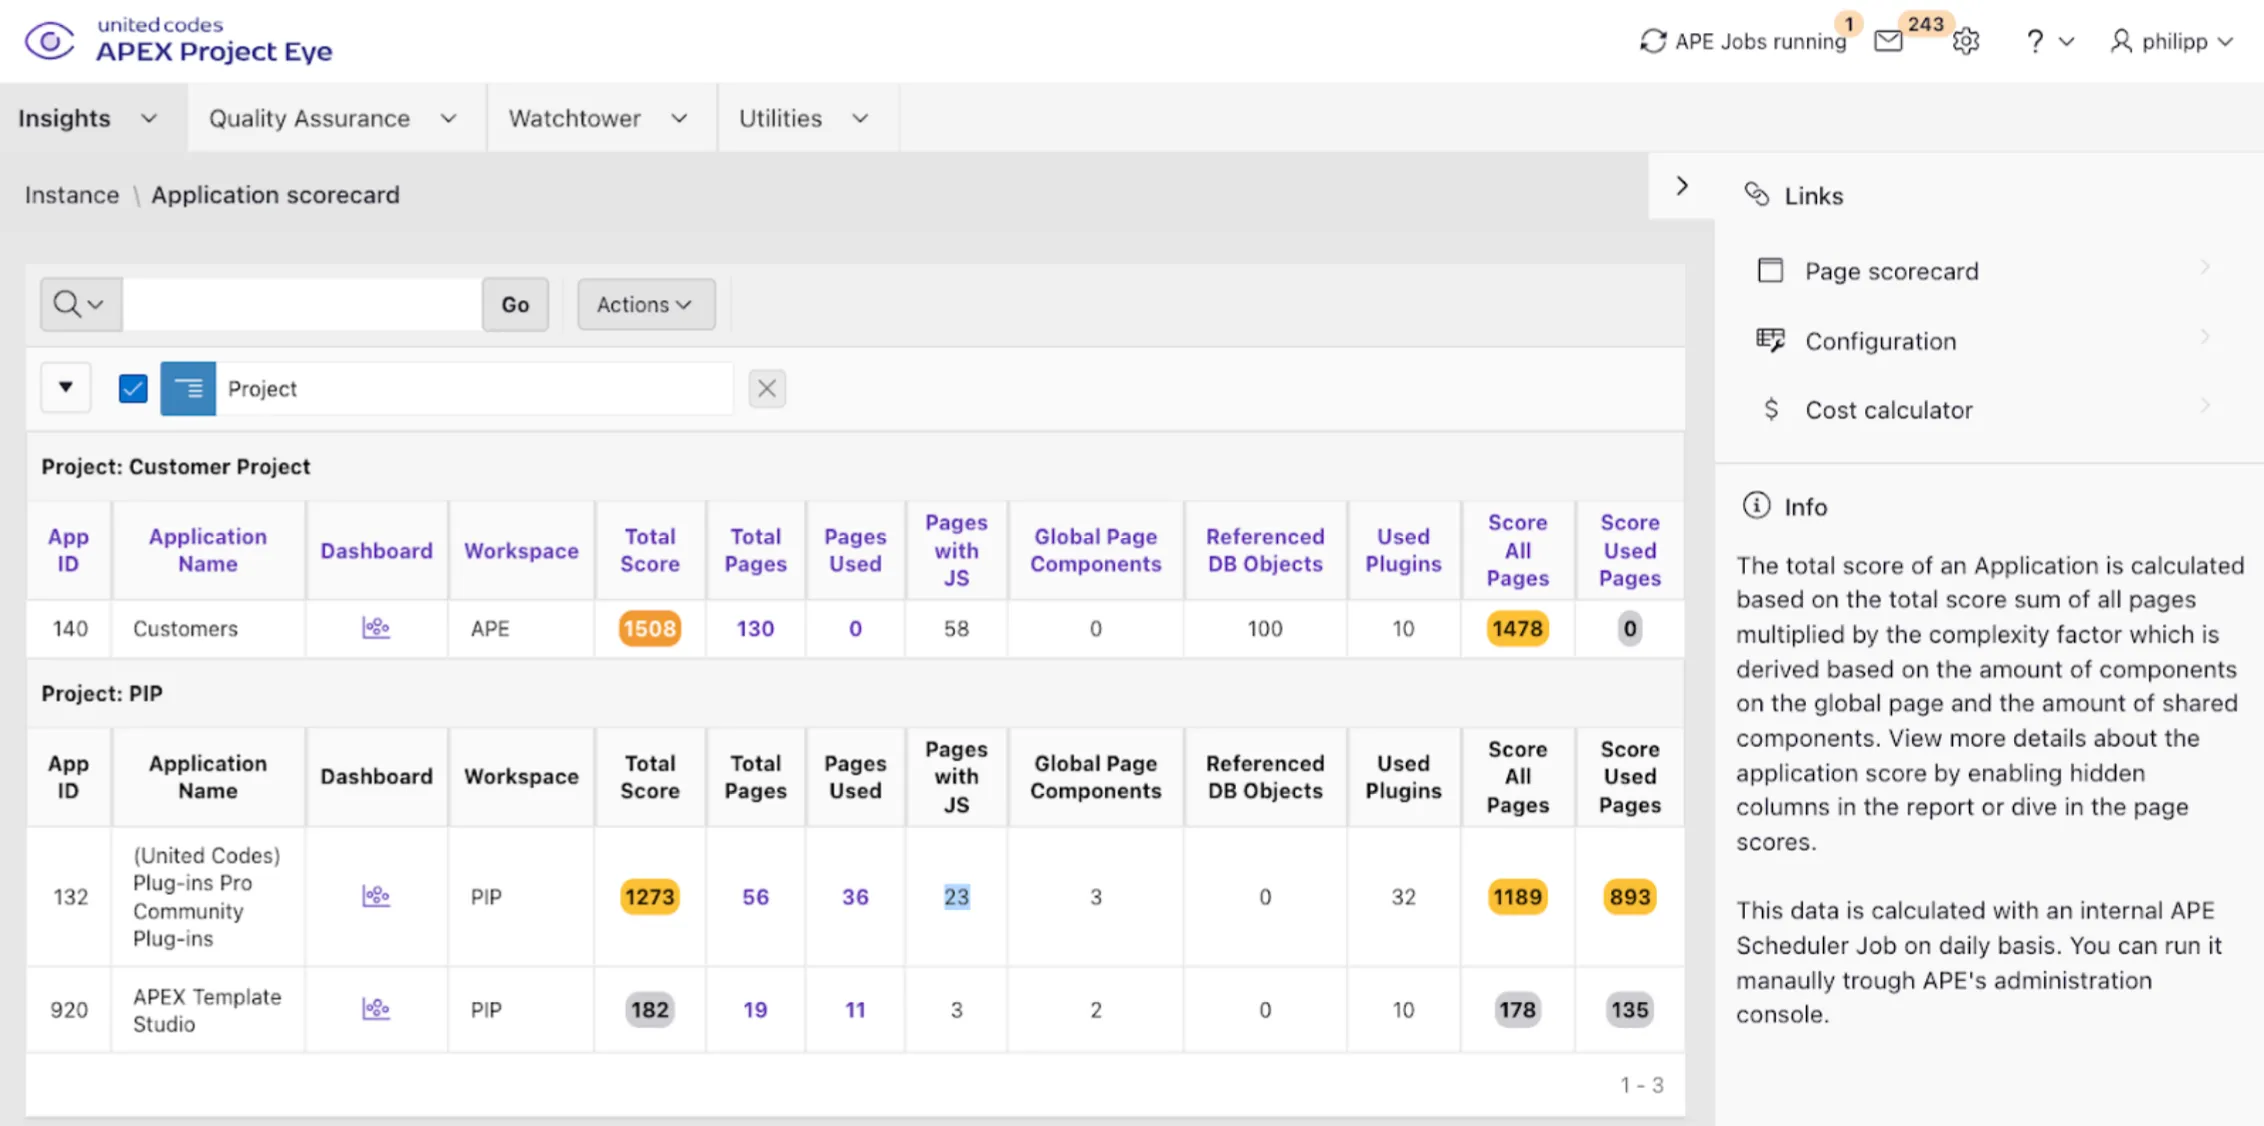
The application scorecard provides an overview of complexity across your entire application
Score Details
Section titled “Score Details”For each application and page, the Scorecard feature provides detailed breakdowns of:
- Overall complexity score
- Component distribution
- Code complexity metrics
- Size metrics
- Usage patterns (when combined with activity data)
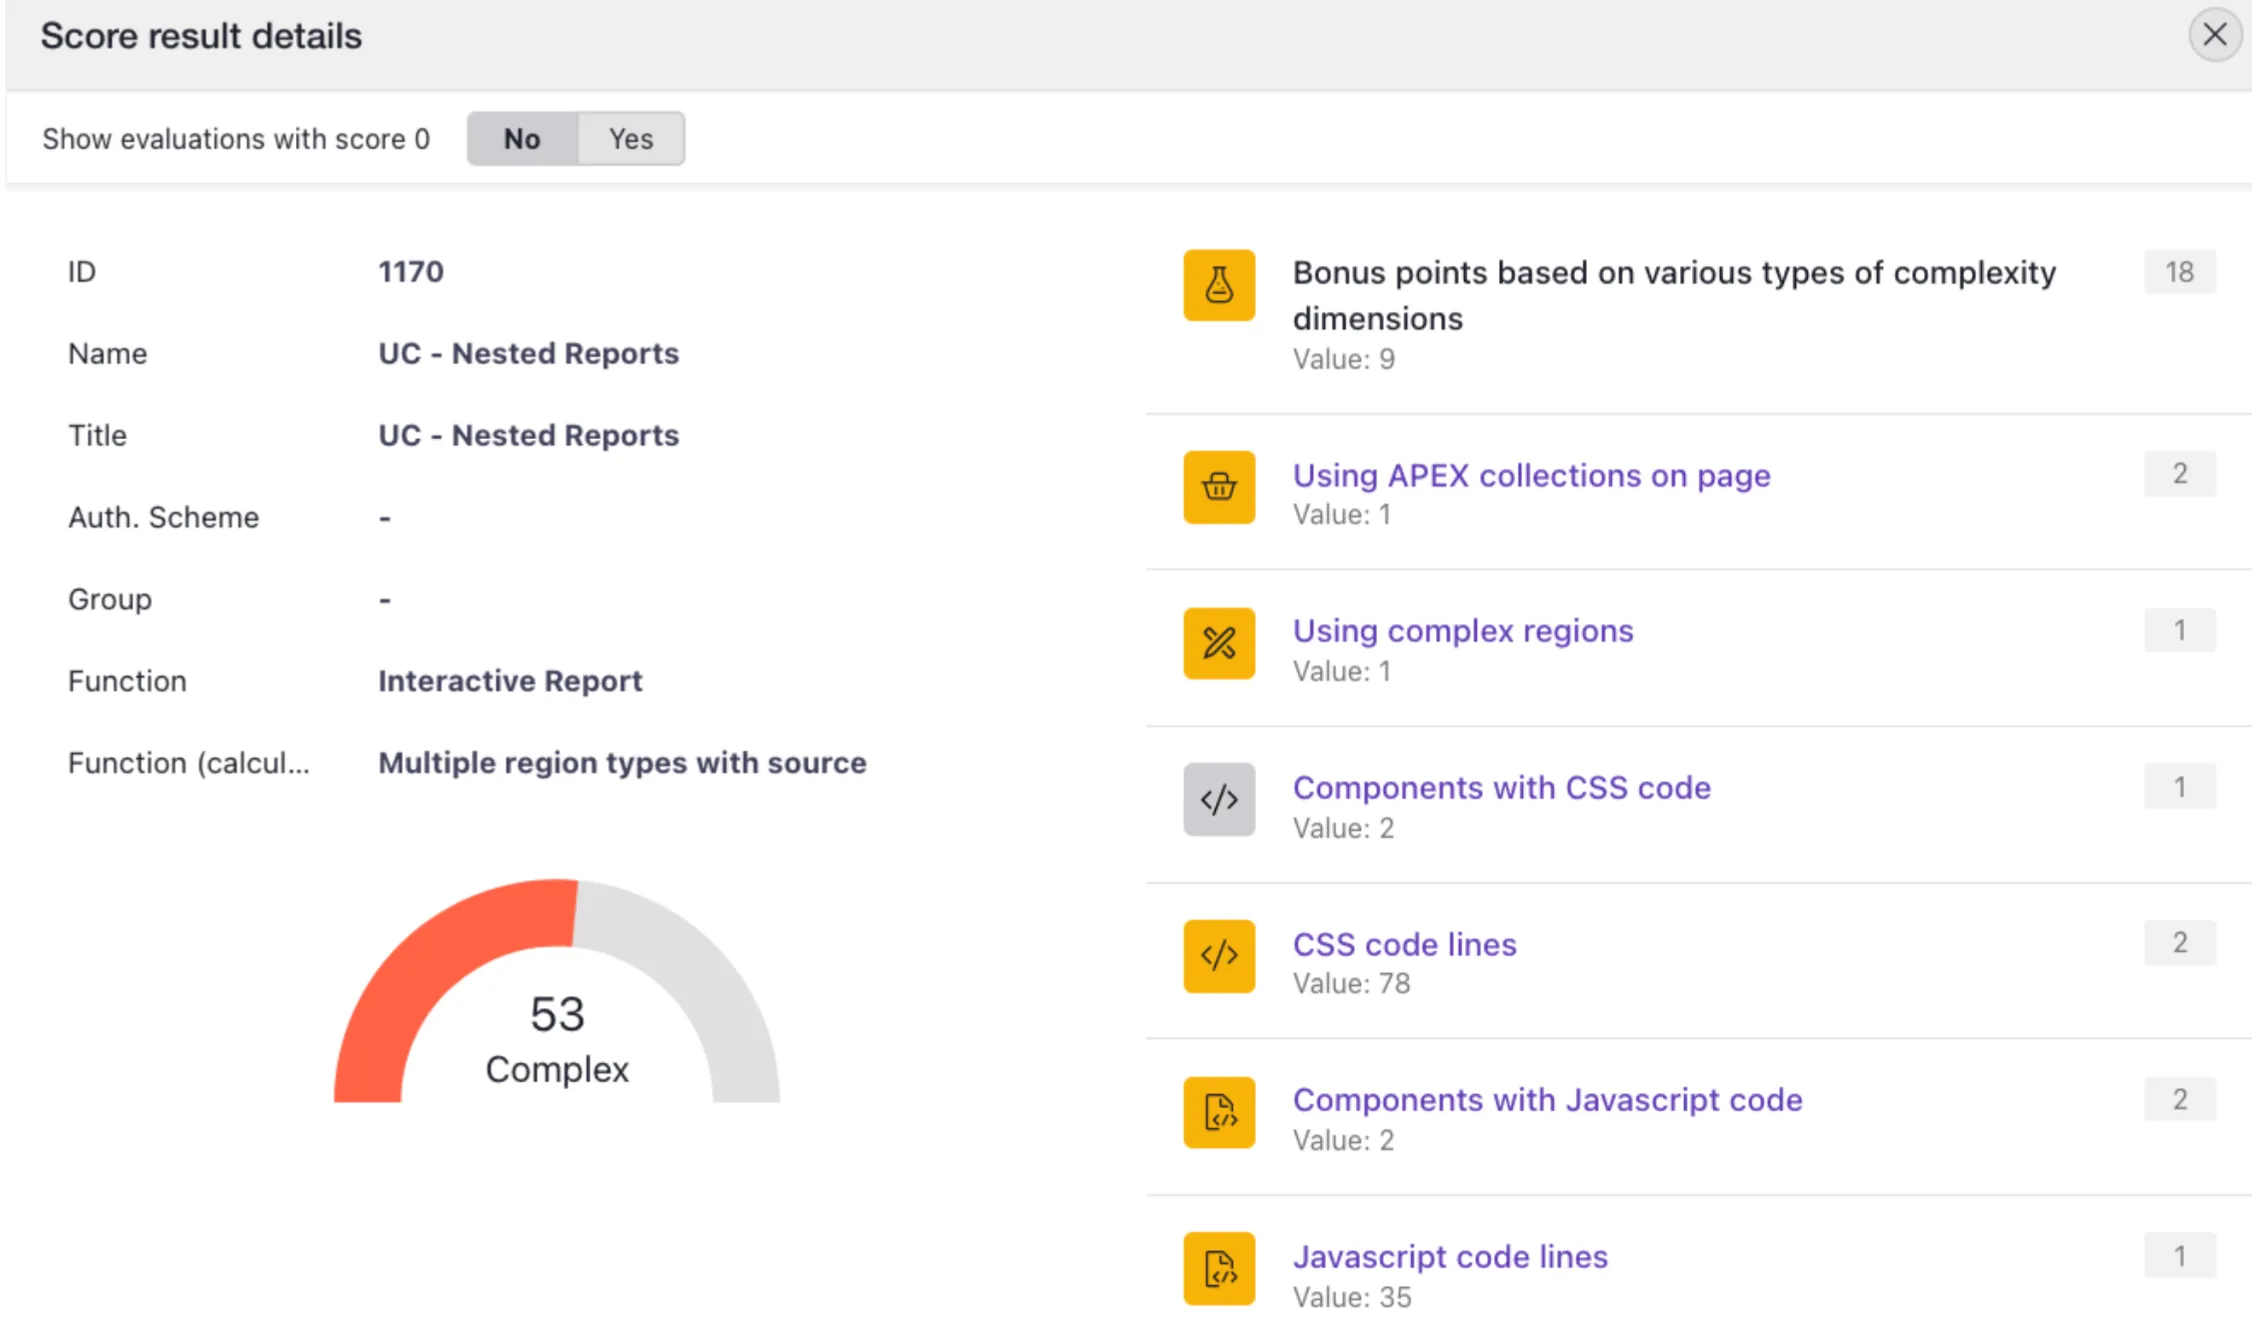
Detailed page complexity metrics help you understand what contributes to complexity
App Complexity Visualization
Section titled “App Complexity Visualization”The bubble chart visualization offers a powerful way to:
- Compare pages across different complexity dimensions
- Identify outliers that may require attention
- See patterns in your application’s structure
- Track complexity changes over time
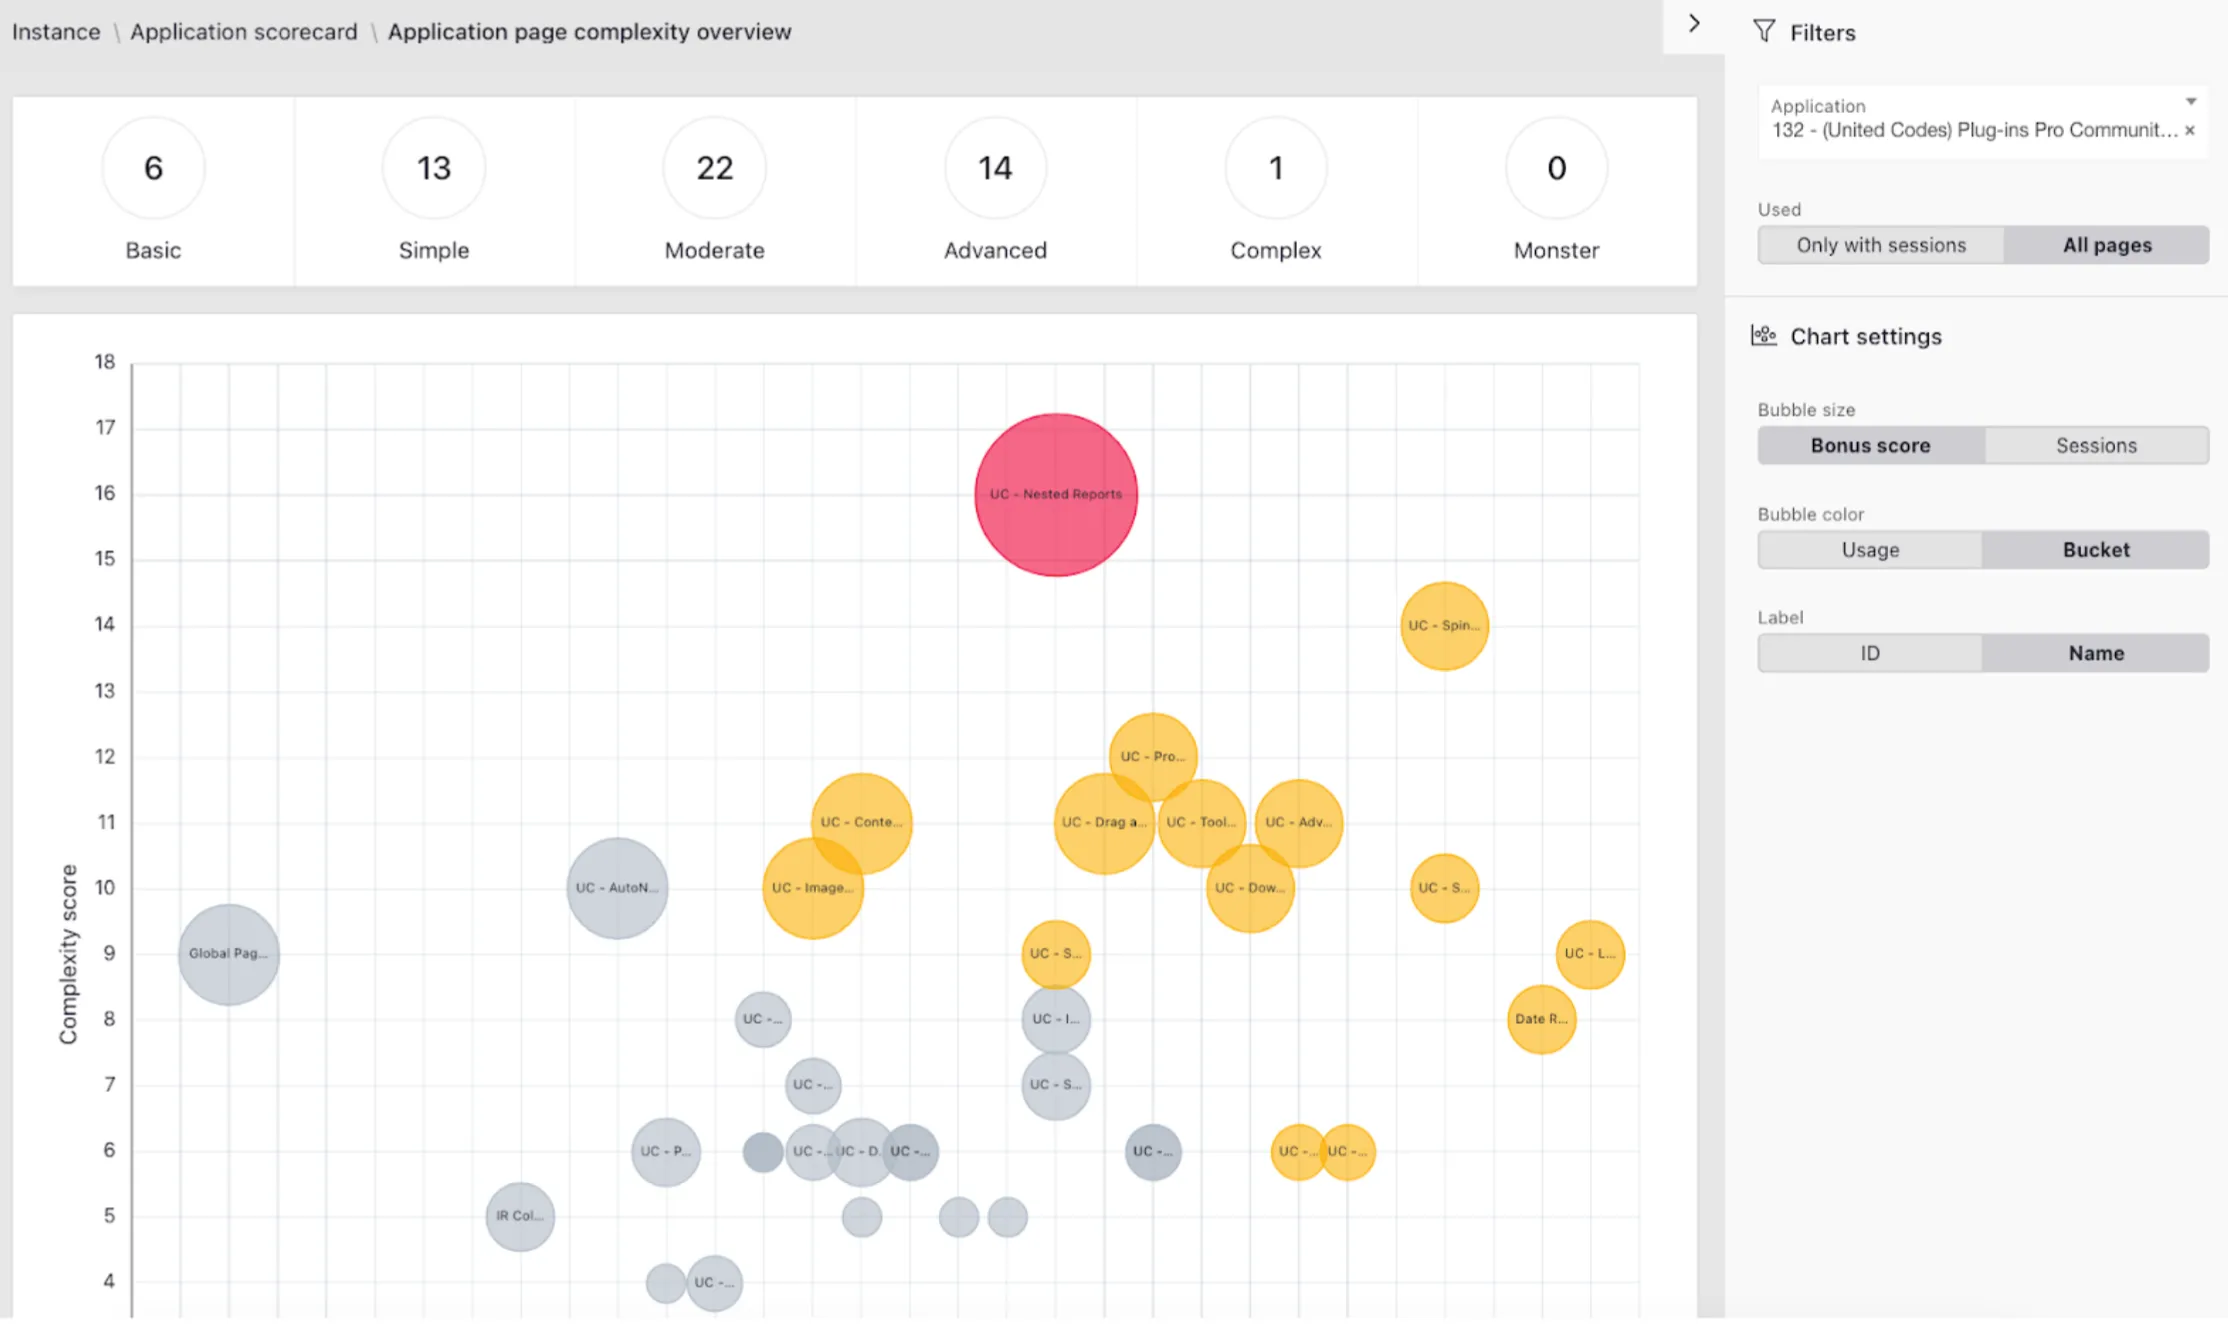
Detailed page complexity metrics help you understand what contributes to complexity.The x-axis represents a size score, while the y-axis represents a complexity score, meaning bubbles in the upper right quadrant are the ones you need to pay attention to.
Cost Calculator
Section titled “Cost Calculator”The integrated cost calculator allows you to:
- Estimate development and maintenance costs based on complexity scores
- Compare different applications or pages in terms of resource requirements
- Plan budgets more accurately for future enhancement projects
- Justify resource allocation to stakeholders
Integration with Other Features
Section titled “Integration with Other Features”The Scorecard feature integrates seamlessly with other APEX Project Eye capabilities:
- Quality Assurance: Correlate complexity scores with quality issues to prioritize improvements
- Technical Documentation: Generate documentation that includes complexity metrics
- Object Dependencies: Understand how complexity relates to database object usage
- Activity Reporting: See how complex pages perform in terms of user engagement
By leveraging the Scorecard feature, development teams can gain deeper insights into their APEX applications, make data-driven decisions about maintenance and refactoring priorities, and optimize resource allocation for maximum efficiency.
Whether you’re managing a single application or an entire portfolio of APEX projects, the Scorecard feature provides valuable metrics to support your application lifecycle management strategy.