DB and ORDS Dashboard
The DB and ORDS Dashboard feature in APEX Project Eye provides comprehensive visibility into your Oracle database environment and Oracle REST Data Services (ORDS). This powerful tool centralizes essential database monitoring and management information, enabling developers and administrators to efficiently monitor, troubleshoot, and optimize their database resources without needing separate tools or direct database access.
Key Benefits
Section titled “Key Benefits”- Consolidated Database Information: Access critical database metrics and details from within your APEX environment
- Proactive Performance Monitoring: Identify bottlenecks and performance issues before they impact users
- Resource Management: Monitor database resource utilization and optimize configuration
- Security Oversight: Track user sessions and monitor security-related database settings
- ORDS Integration: View and manage Oracle REST Data Services connections and configurations
Database Insights
Section titled “Database Insights”The dashboard provides comprehensive information about your Oracle database environment:
- Version Information: View detailed database version data, patch levels, and configuration details
- Database Registry: Examine installed components and their status
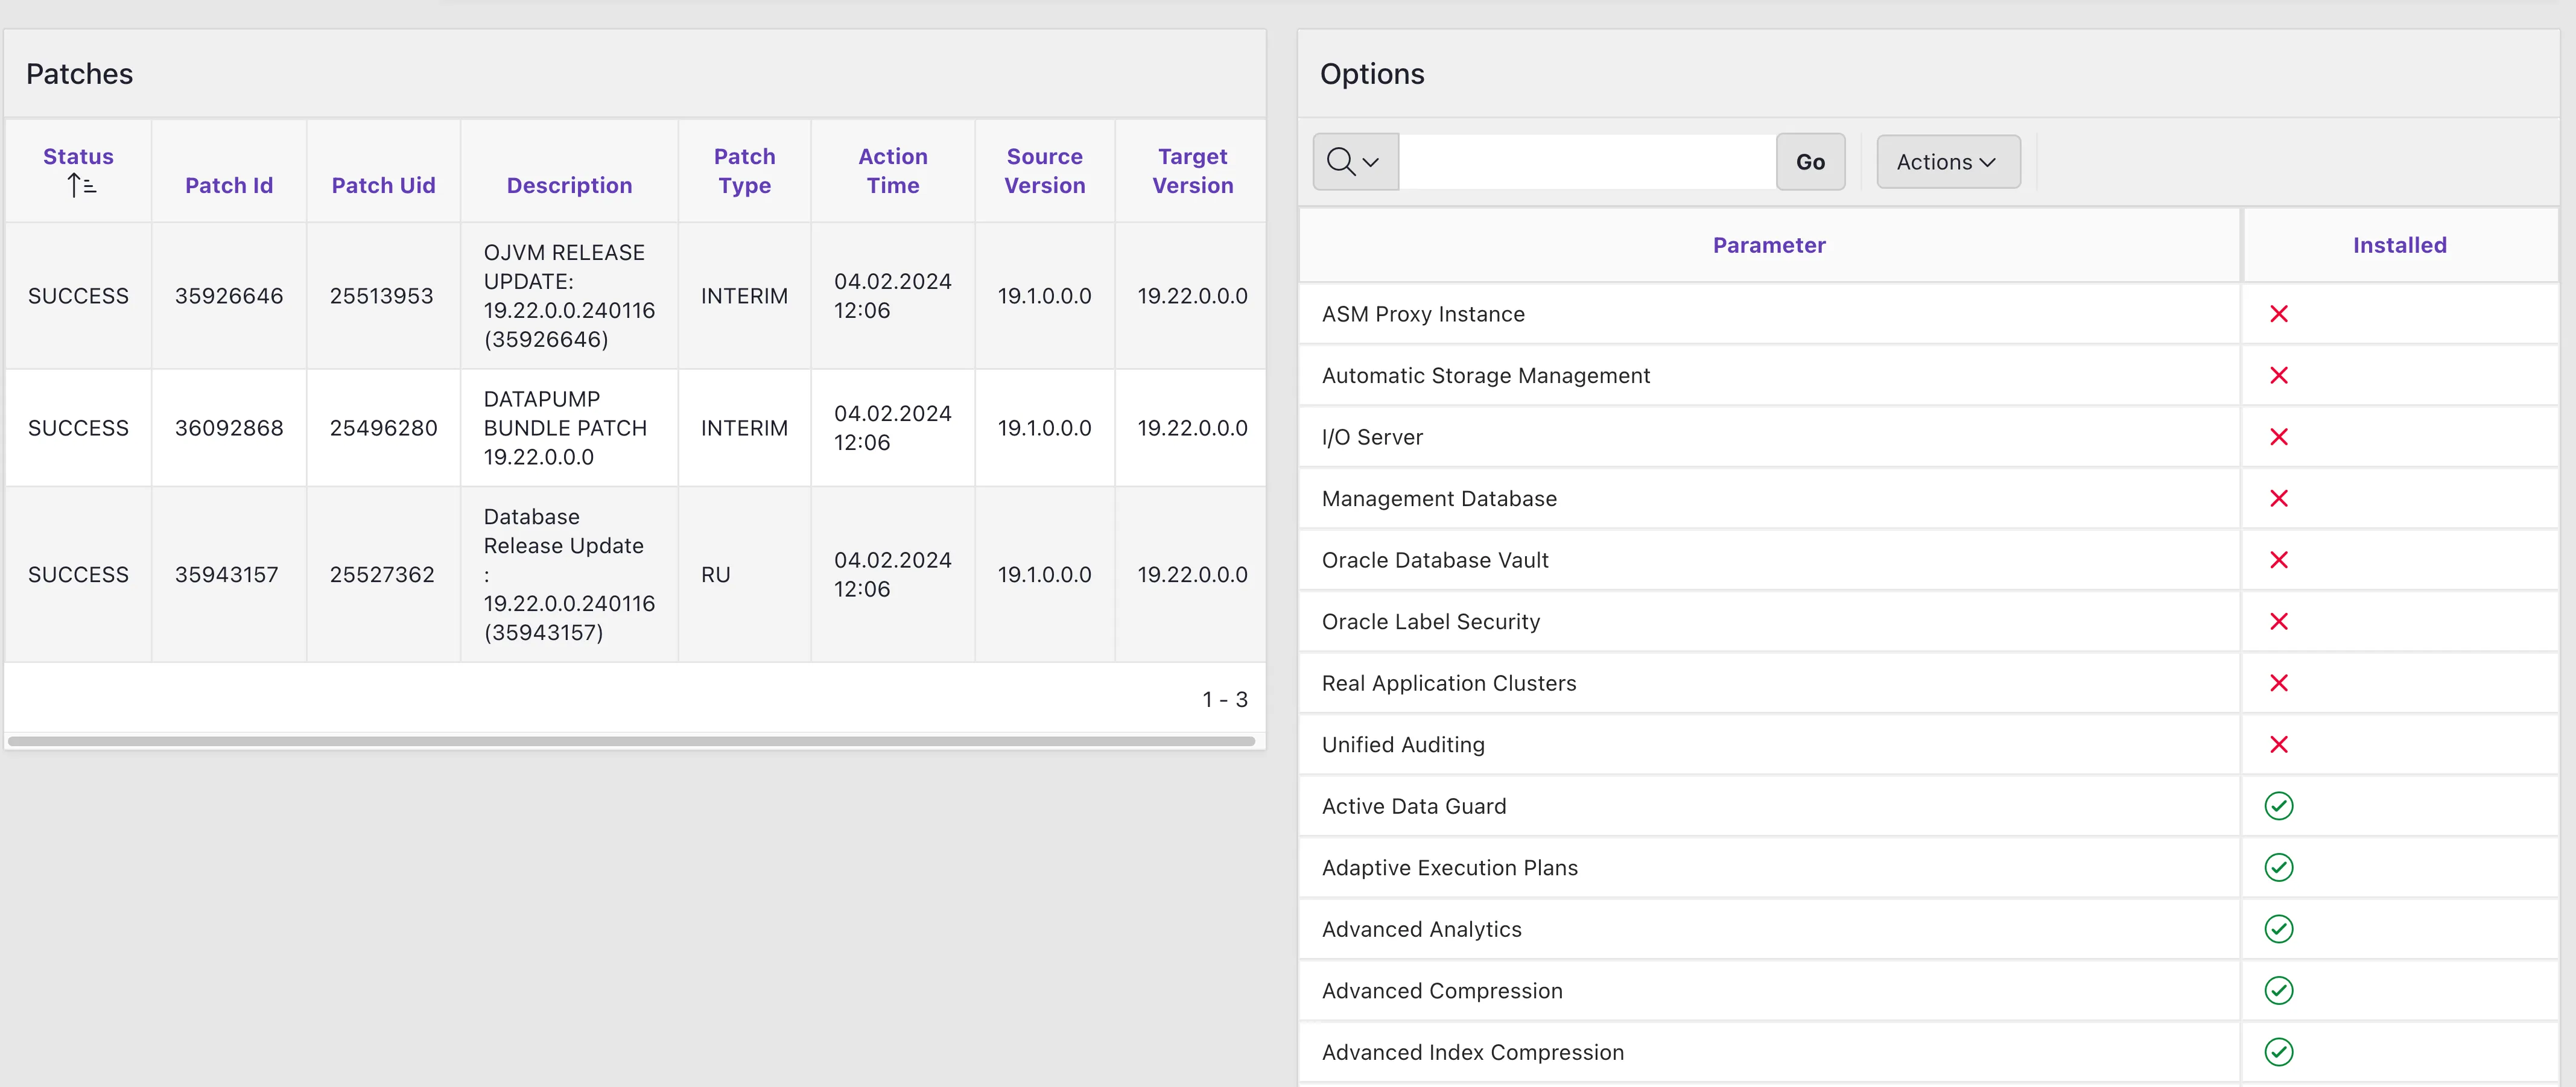
- Database Options: See which database options are installed and enabled
- Patch History: Review applied patches and updates
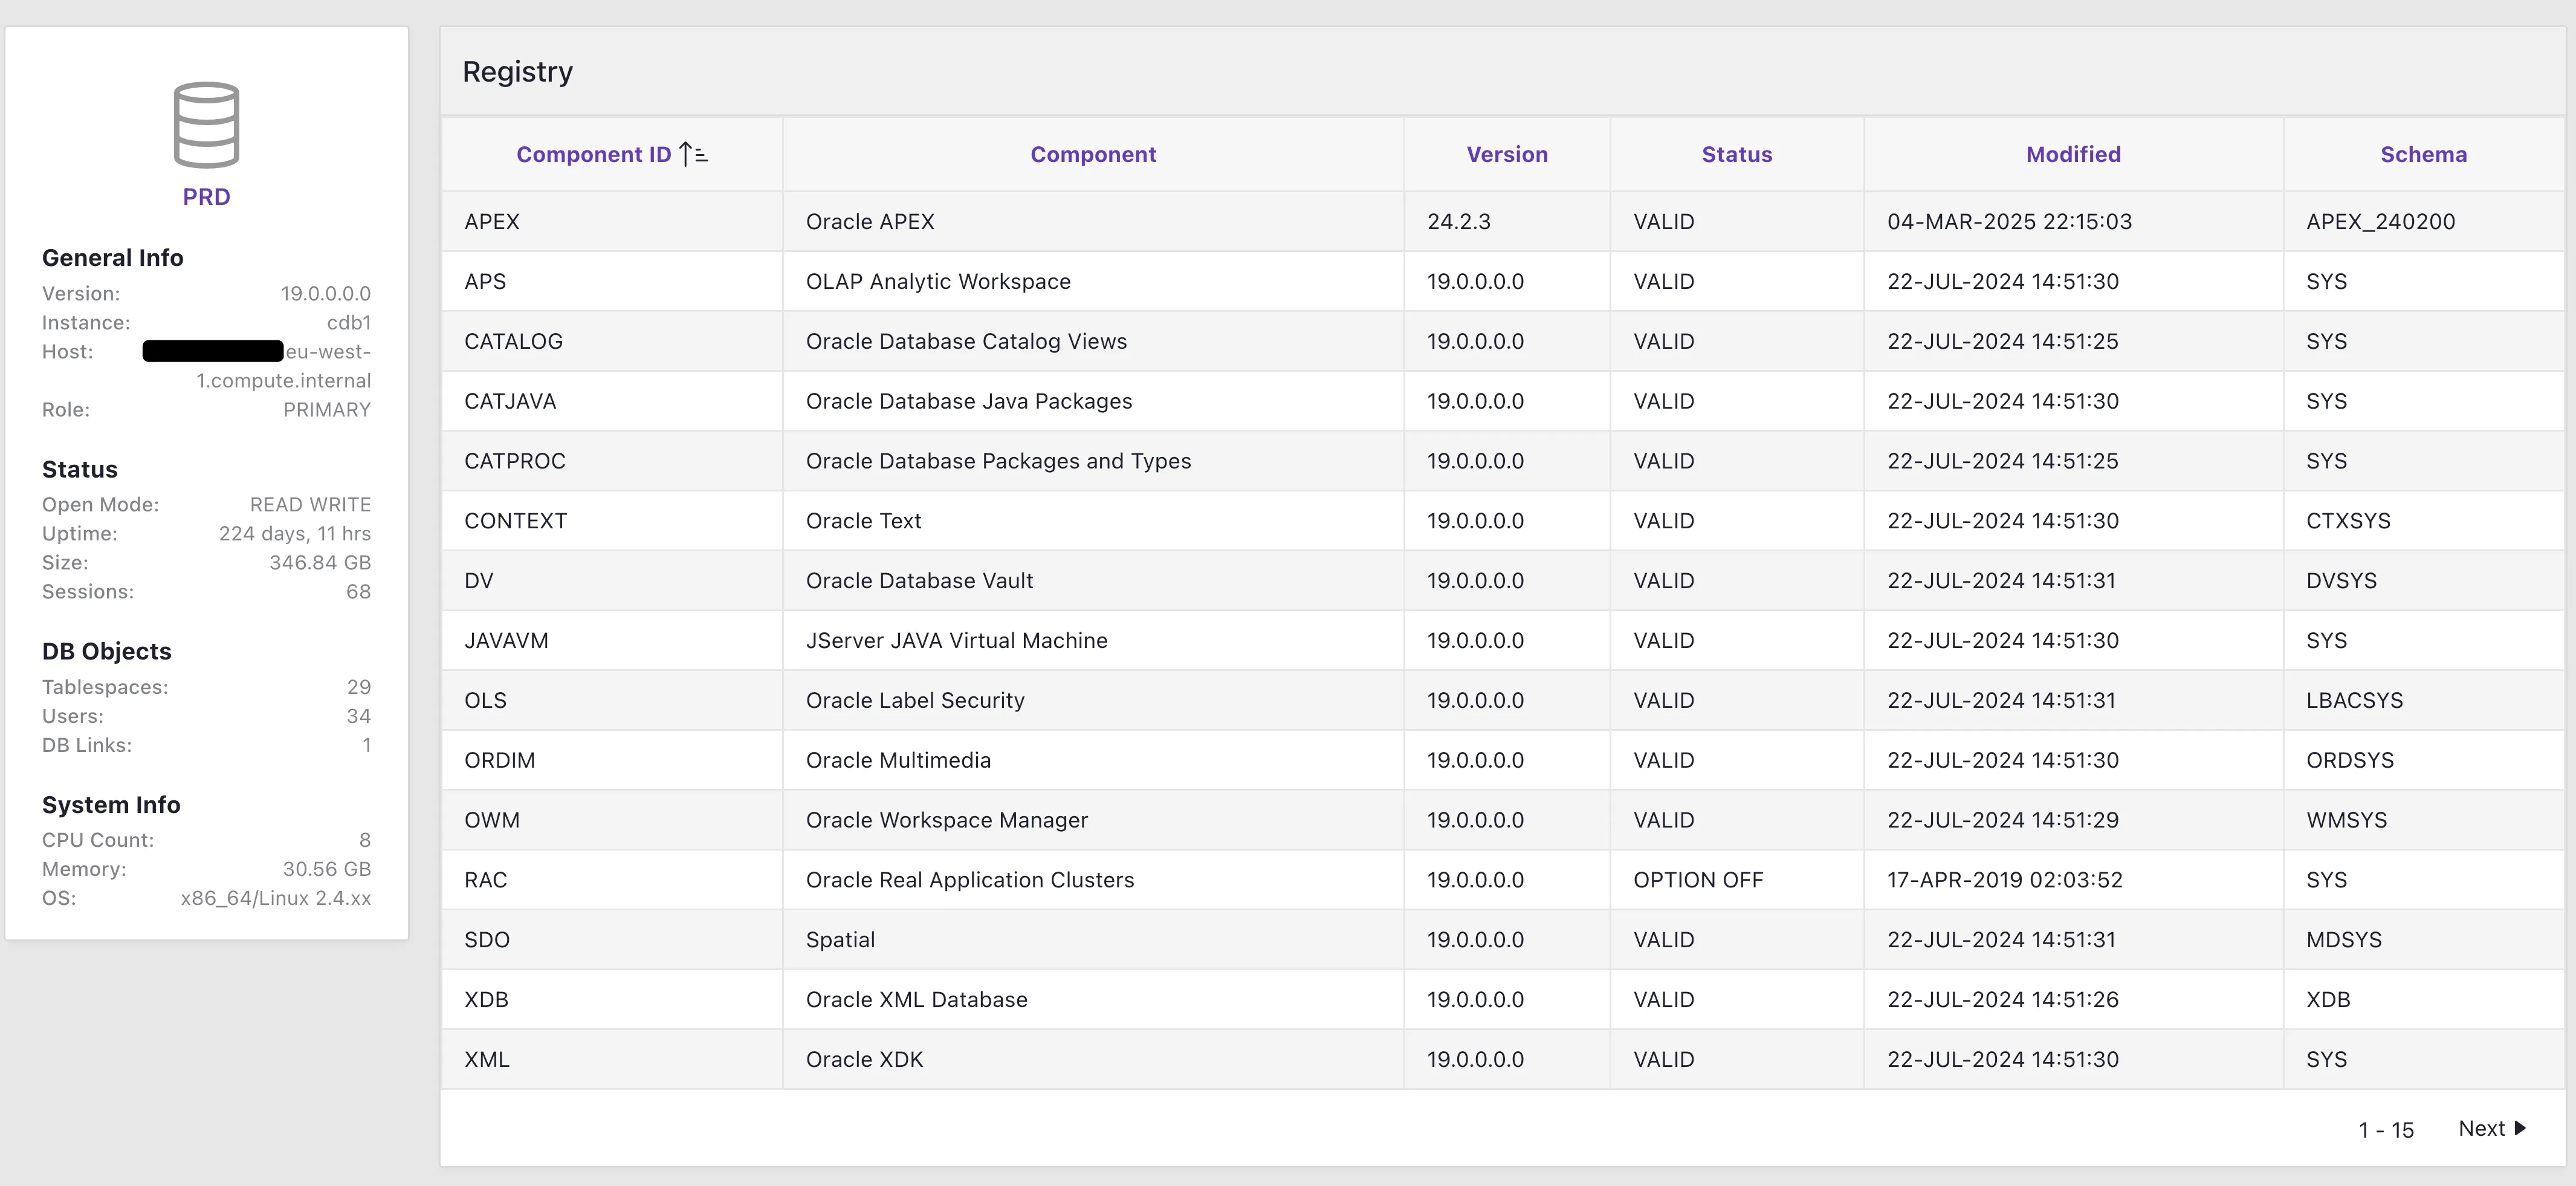
Get a complete overview of your database environment in one place
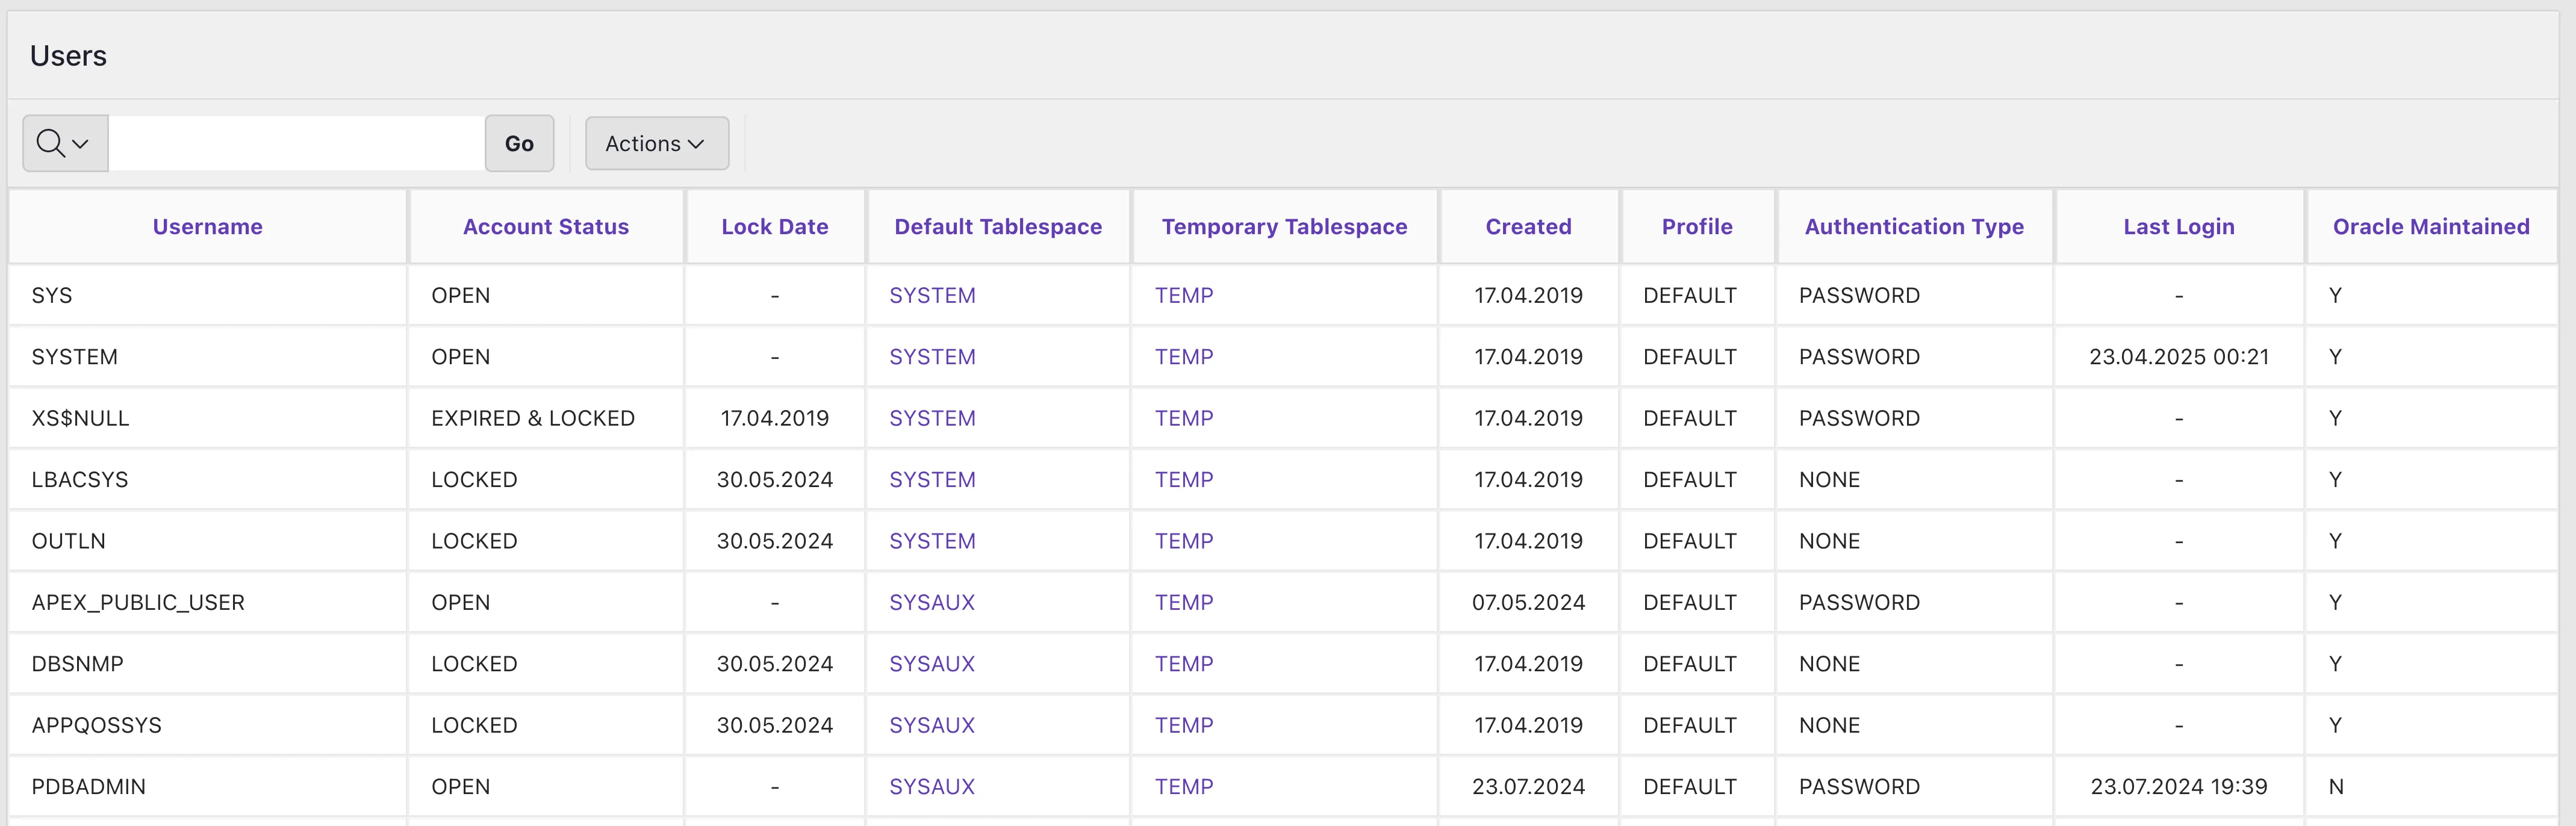
User Management
Section titled “User Management”Monitor and manage Oracle database users with detailed information:
- User Listings: See all database users with account status and profile details
- Account Management: Track password expiration and account usage
Tablespace Monitoring
Section titled “Tablespace Monitoring”Keep track of database storage resources:
- Tablespace Utilization: Monitor space usage and growth
- Space Allocation: See how space is allocated across tablespaces
- Storage Configuration: Review tablespace settings and parameters
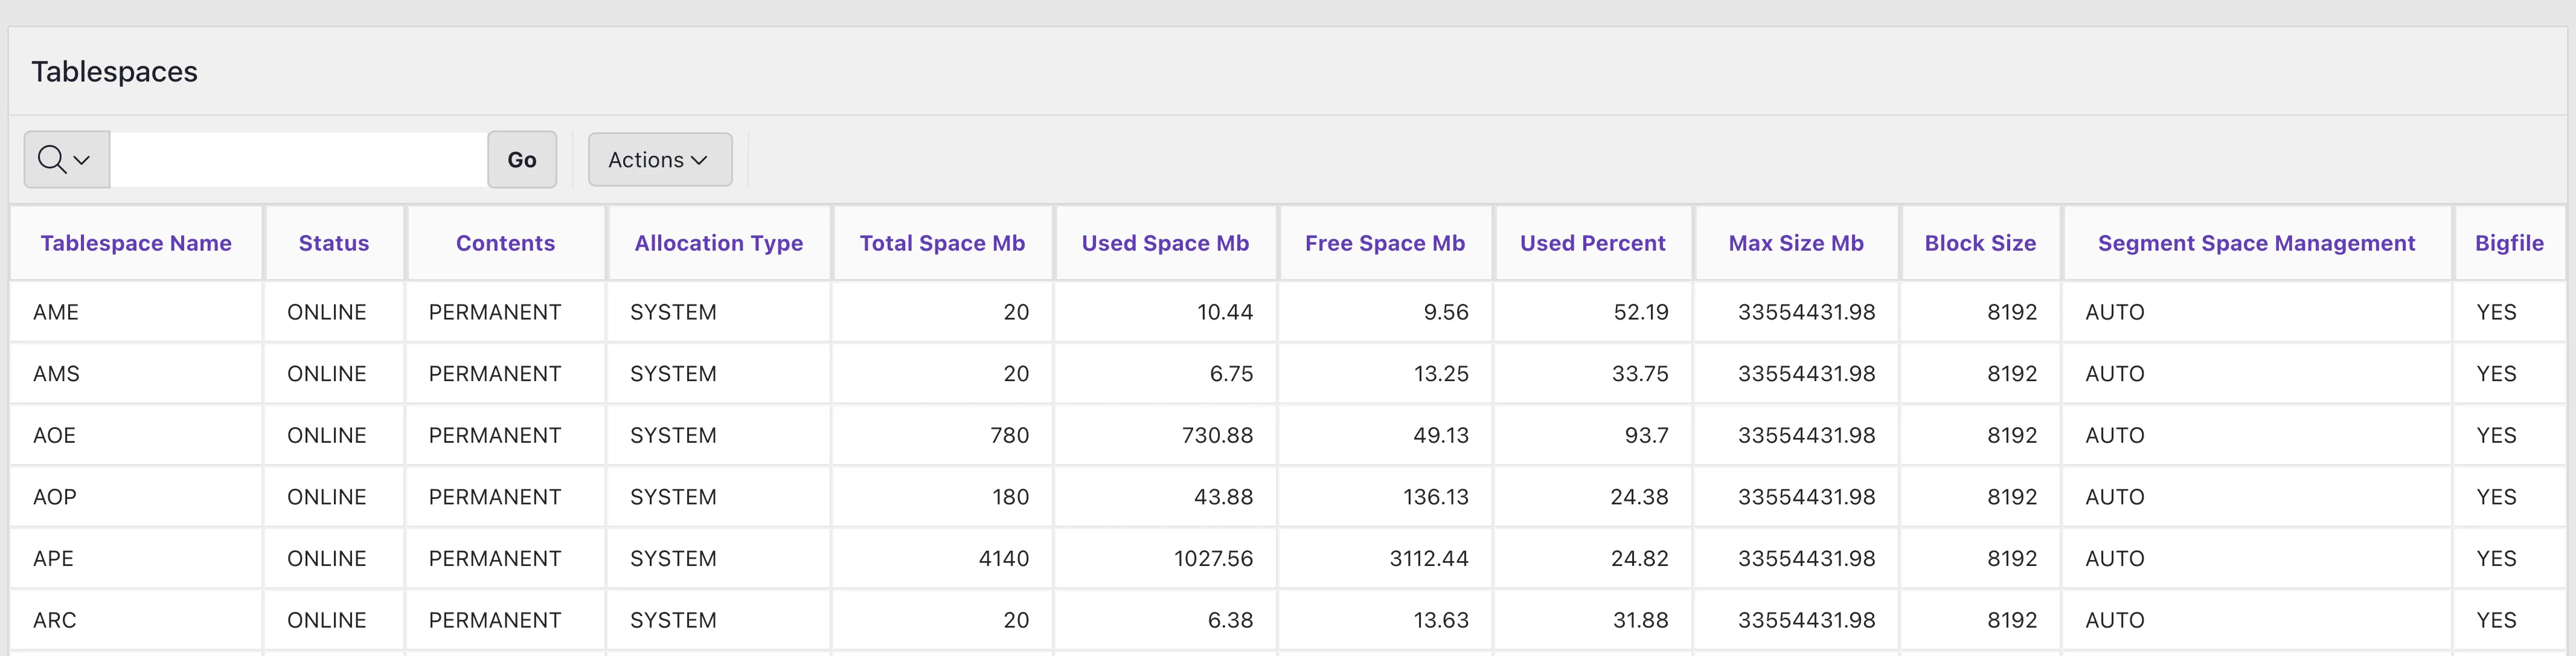
Monitor your database tablespaces to optimize storage allocation
Session Management
Section titled “Session Management”Monitor active Oracle sessions and connections:
- Active Sessions: View all current database sessions with detailed information
- Blocking Sessions: Quickly identify and resolve session blocking issues
- Session Statistics: Analyze session resource usage and performance metrics
- SQL Statements: Click on any SQL ID to view the SQL statement being executed
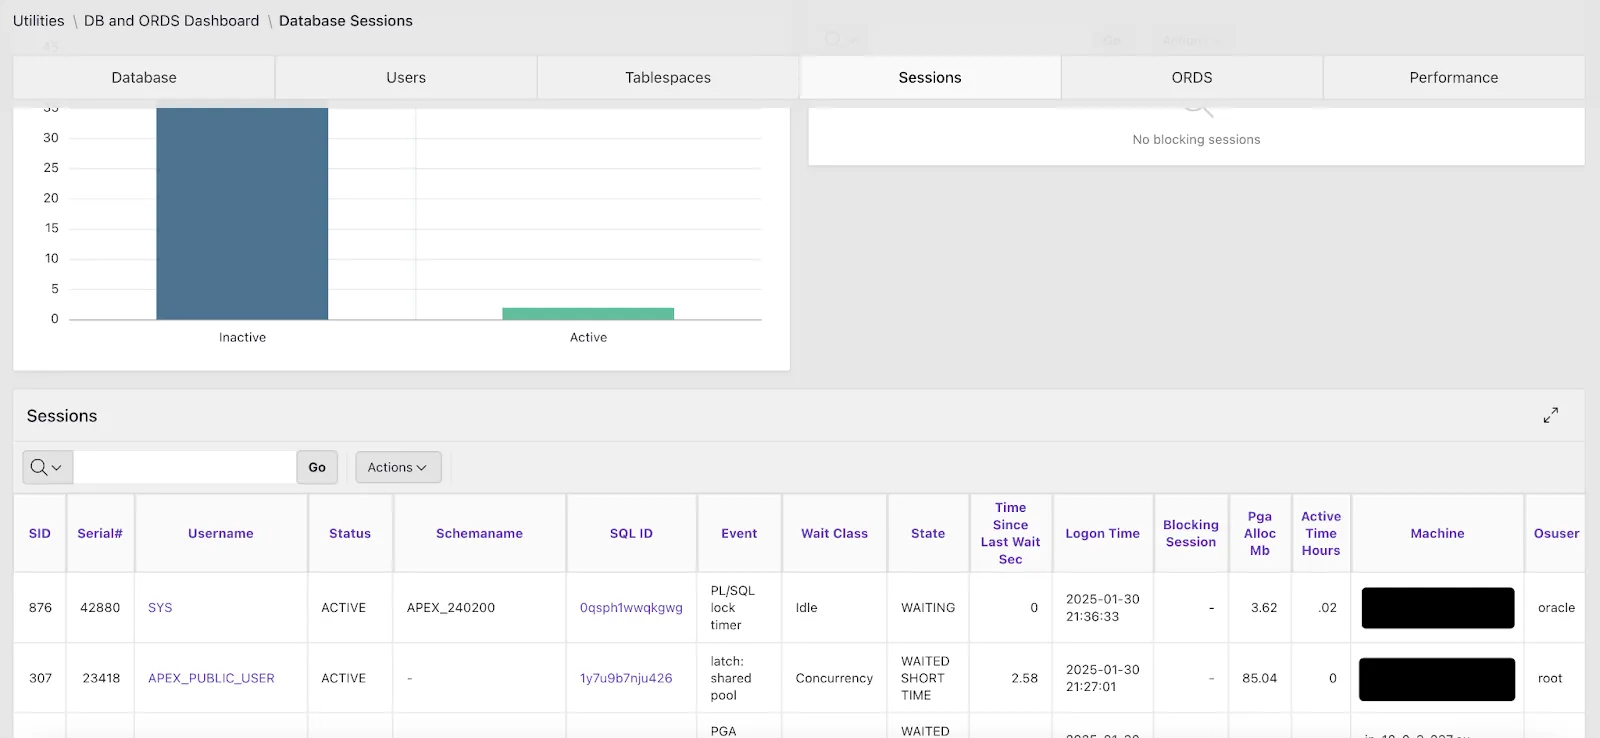
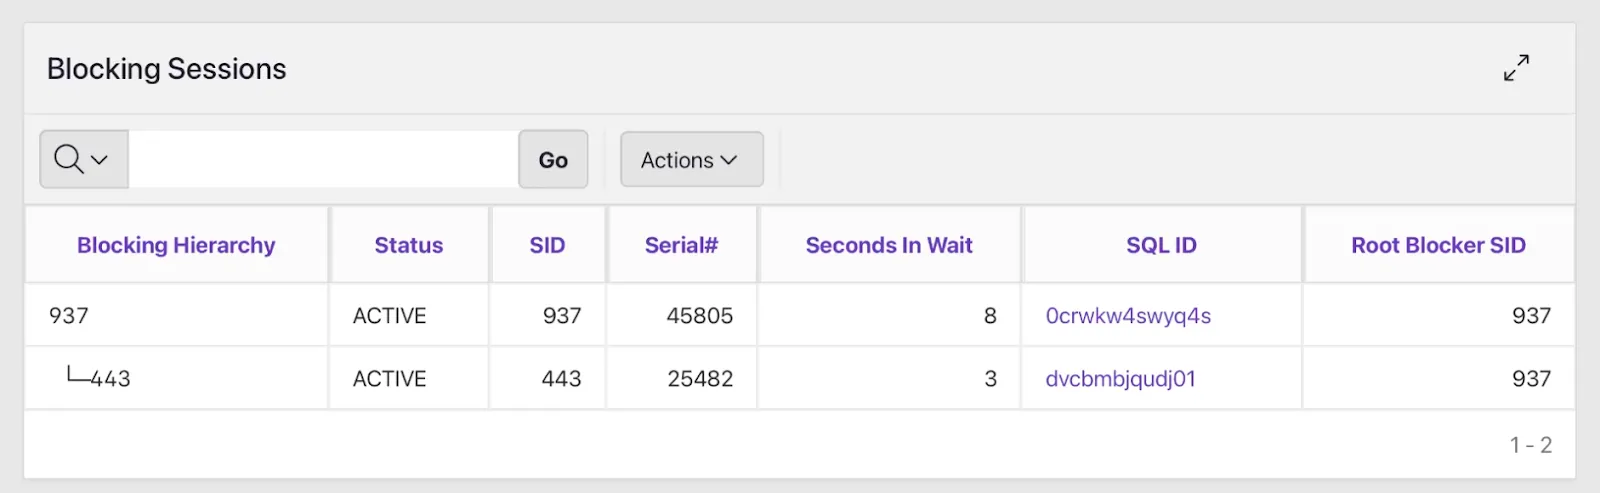
Monitor active sessions and quickly identify blocking sessions
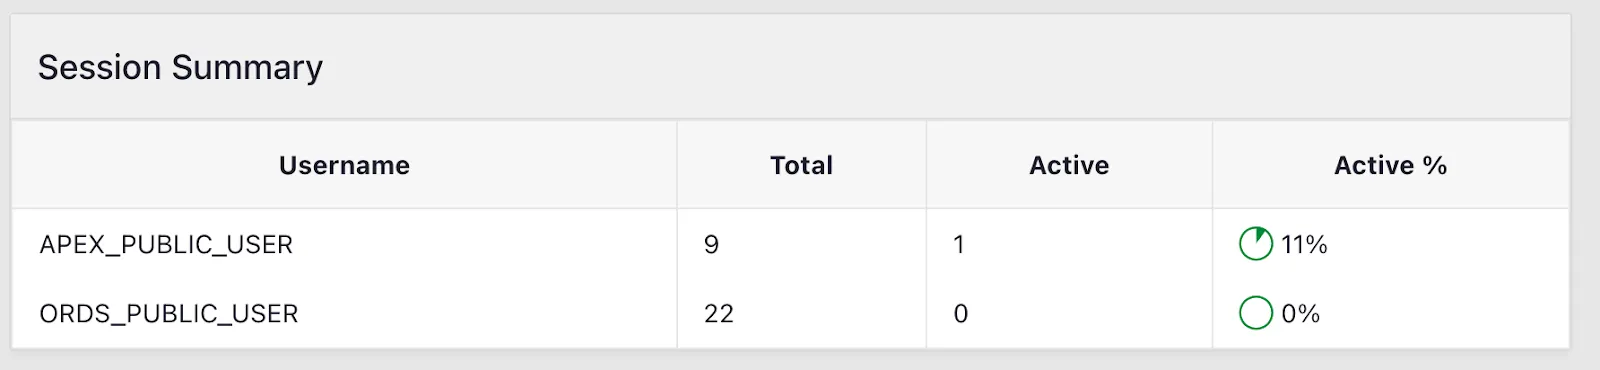
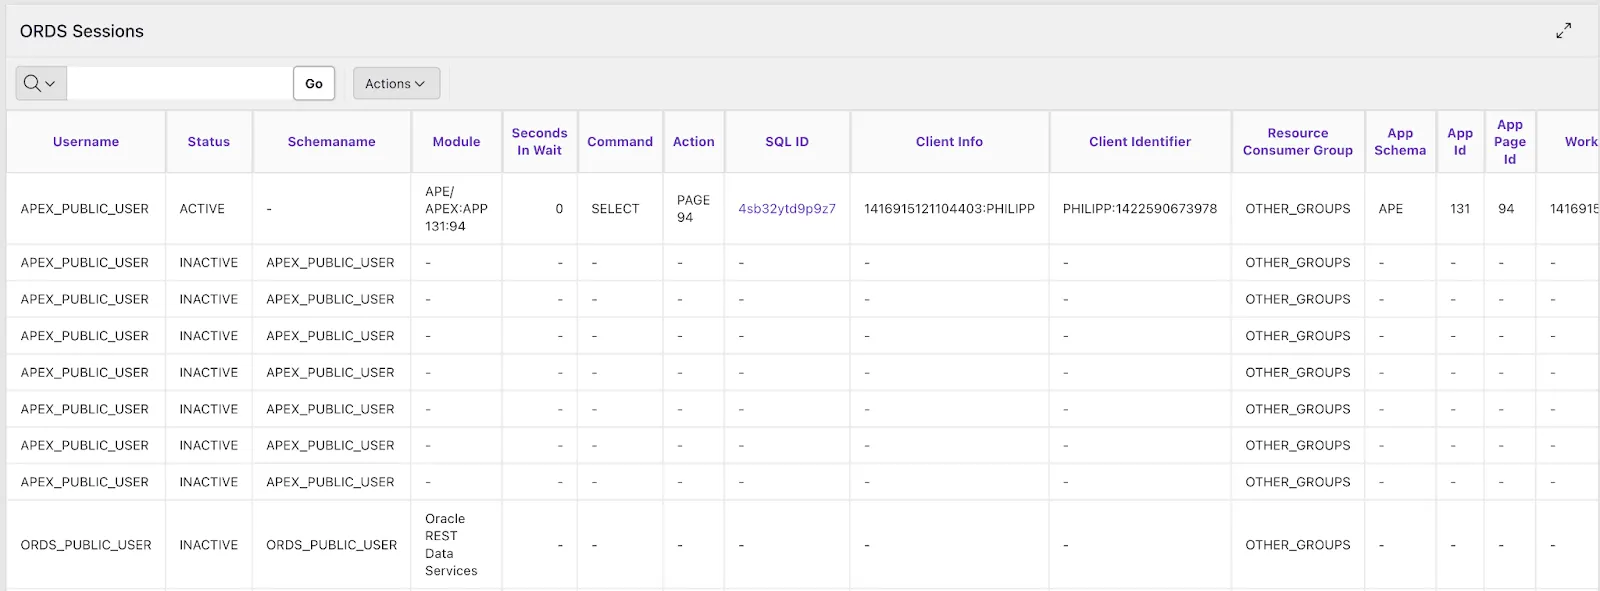
ORDS Monitoring
Section titled “ORDS Monitoring”For environments using Oracle REST Data Services:
- ORDS Sessions: Track active ORDS sessions and their resource usage
- Session Summary: Get aggregated statistics on ORDS usage by APEX_PUBLIC_USER and ORDS_PUBLIC_USER
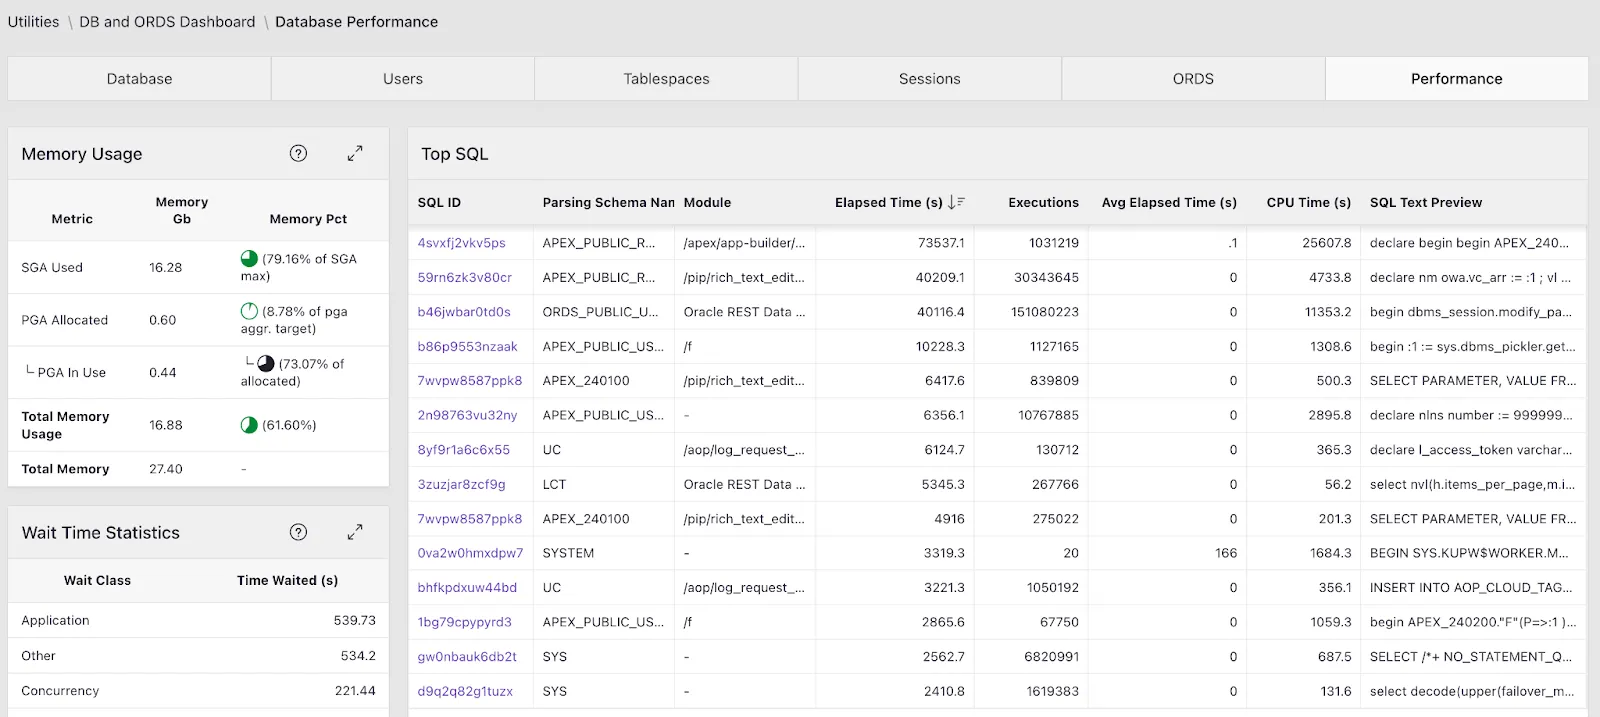
Performance Analytics
Section titled “Performance Analytics”Gain insights into database performance:
- CPU & Wait Time: Analyze database performance with CPU and wait time statistics
- Memory Usage: Monitor memory allocation and utilization across database components
- Top SQL: Identify resource-intensive SQL statements that might need optimization
- Wait Events: Track database wait events to identify bottlenecks