Activity Reporting
The Activity Reporting feature in APEX Project Eye provides comprehensive insights into how users interact with your Oracle APEX applications. This robust analytics toolset helps you understand usage patterns, identify trends, and make data-driven decisions about application development and optimization through detailed activity data visualization and reporting.
Key Benefits
Section titled “Key Benefits”- Usage Analytics: Understand how users interact with your applications
- Performance Insights: Identify performance bottlenecks affecting user experience
- Resource Optimization: Allocate development resources to heavily used features
- Trend Identification: Spot trends in application usage over time
- Application ROI: Measure application adoption and utilization
- Issue Detection: Identify problematic pages or features based on usage patterns
Workspace Dashboard
Section titled “Workspace Dashboard”Get a comprehensive overview of Oracle APEX application activity:
- Key Metrics: Monitor essential usage statistics at a glance
- Activity Trends: Track changes in usage patterns over time
- Top Apps: Identify your most frequently accessed pages
- User and Error Distribution: See how activity is distributed across users
- Biggest Tables: Quickly identify the largest tables in your database
- Mail Statistics: Monitor email activity related to your applications
- Performance Metrics: Analyze performance data to identify bottlenecks
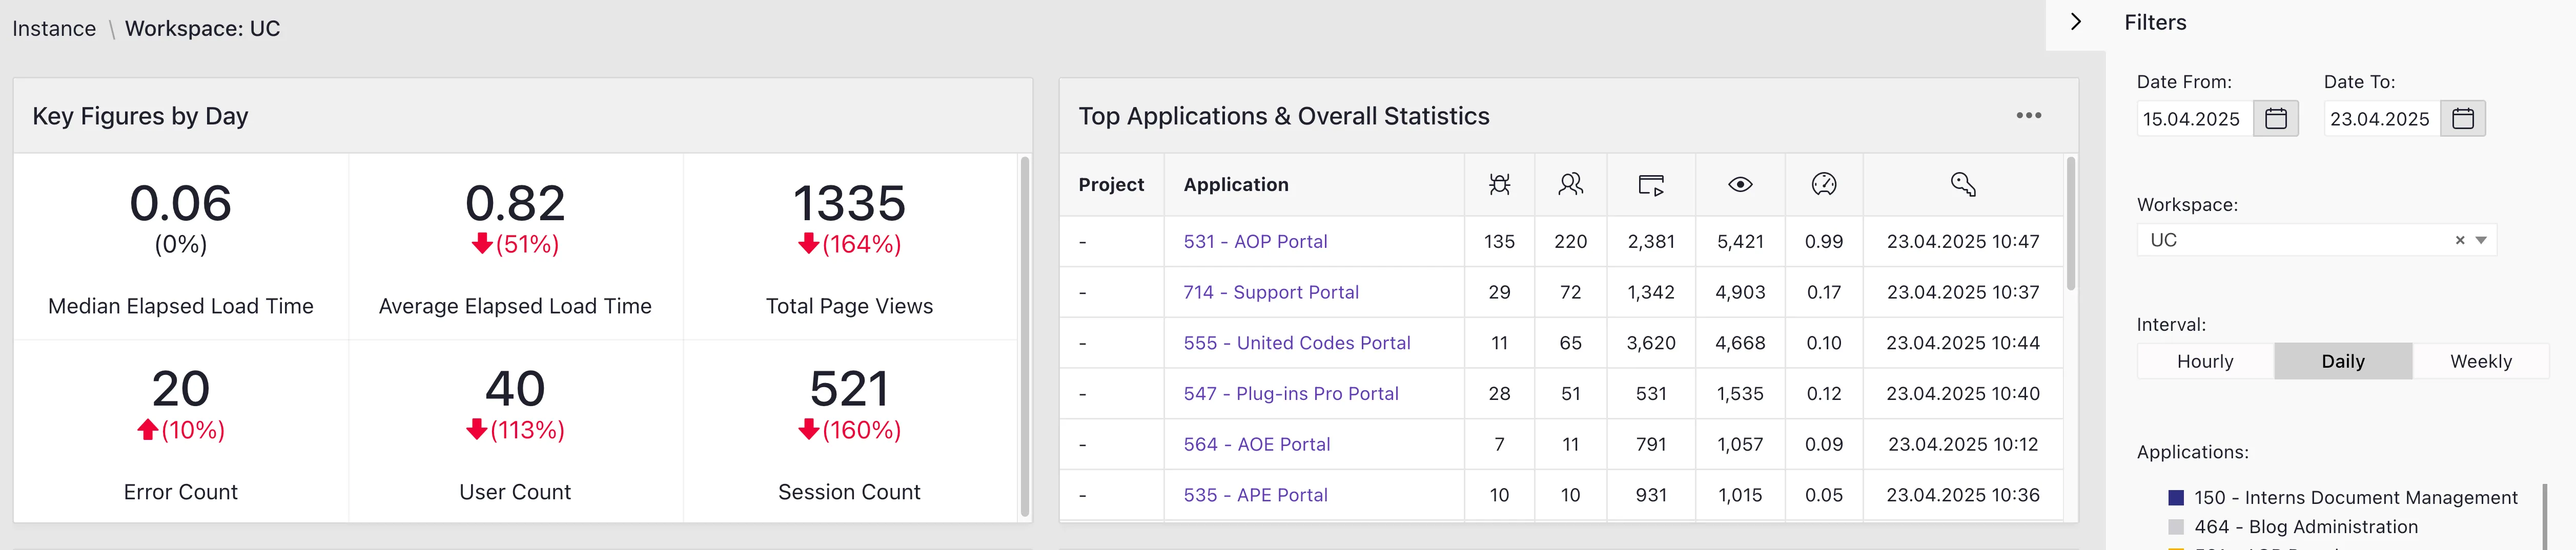
Comprehensive overview of key figures and the top used apps
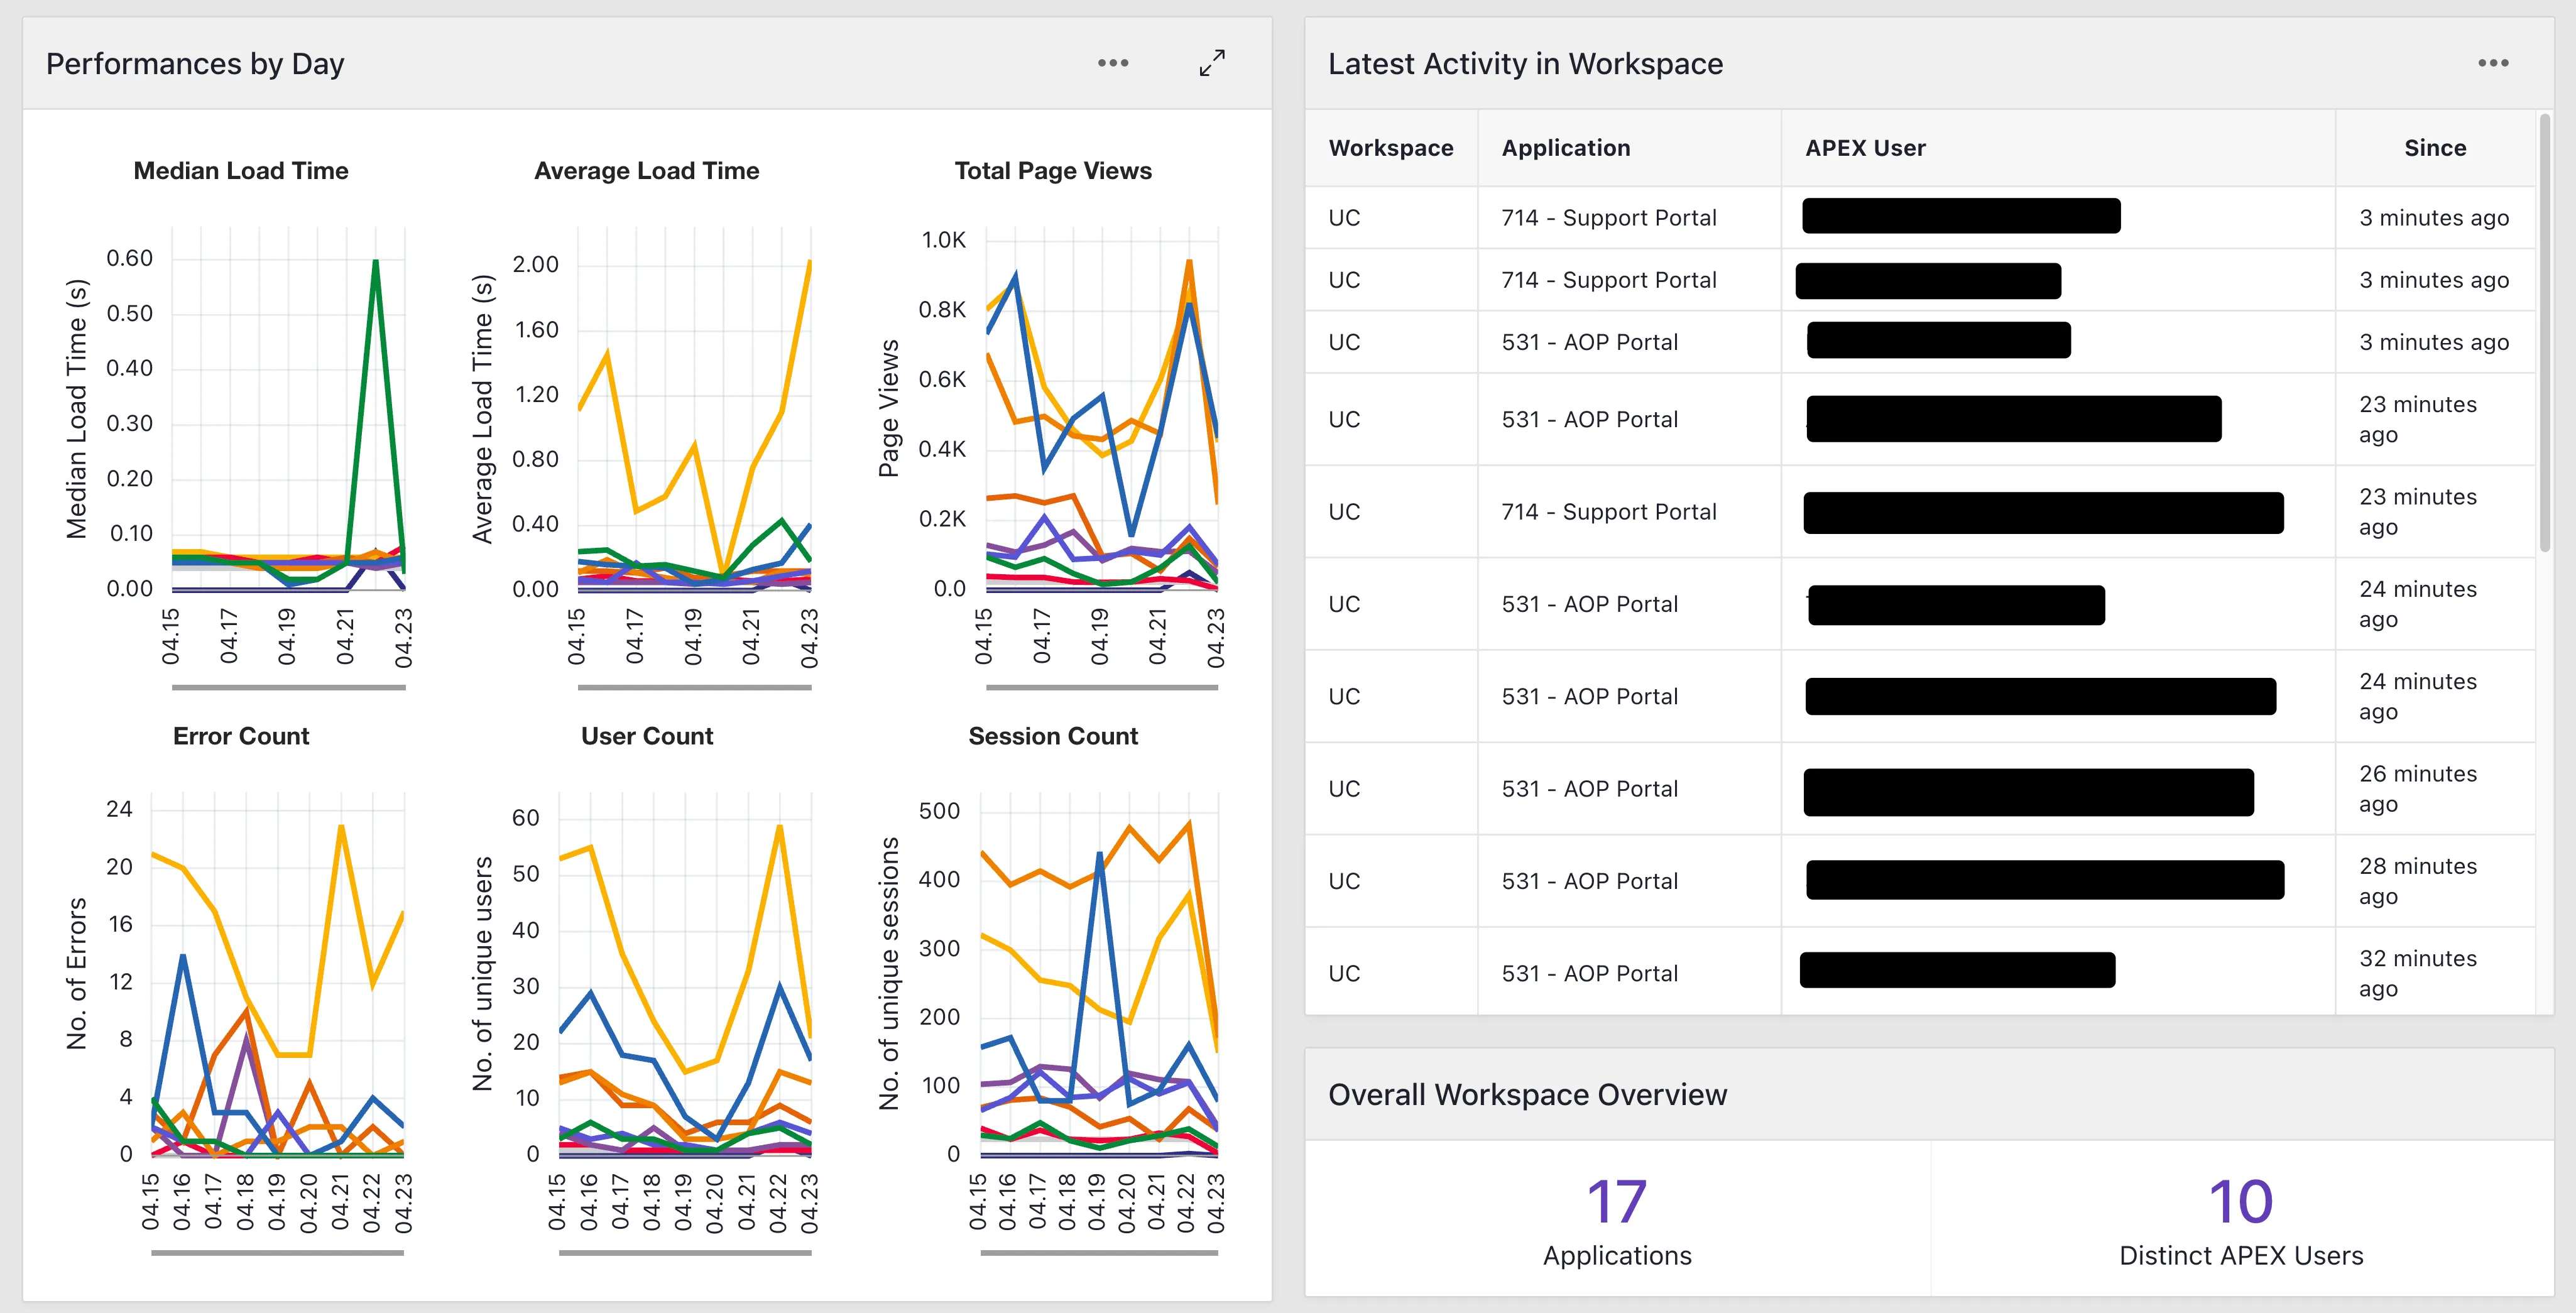
Performance mectrics and latest activity indicator
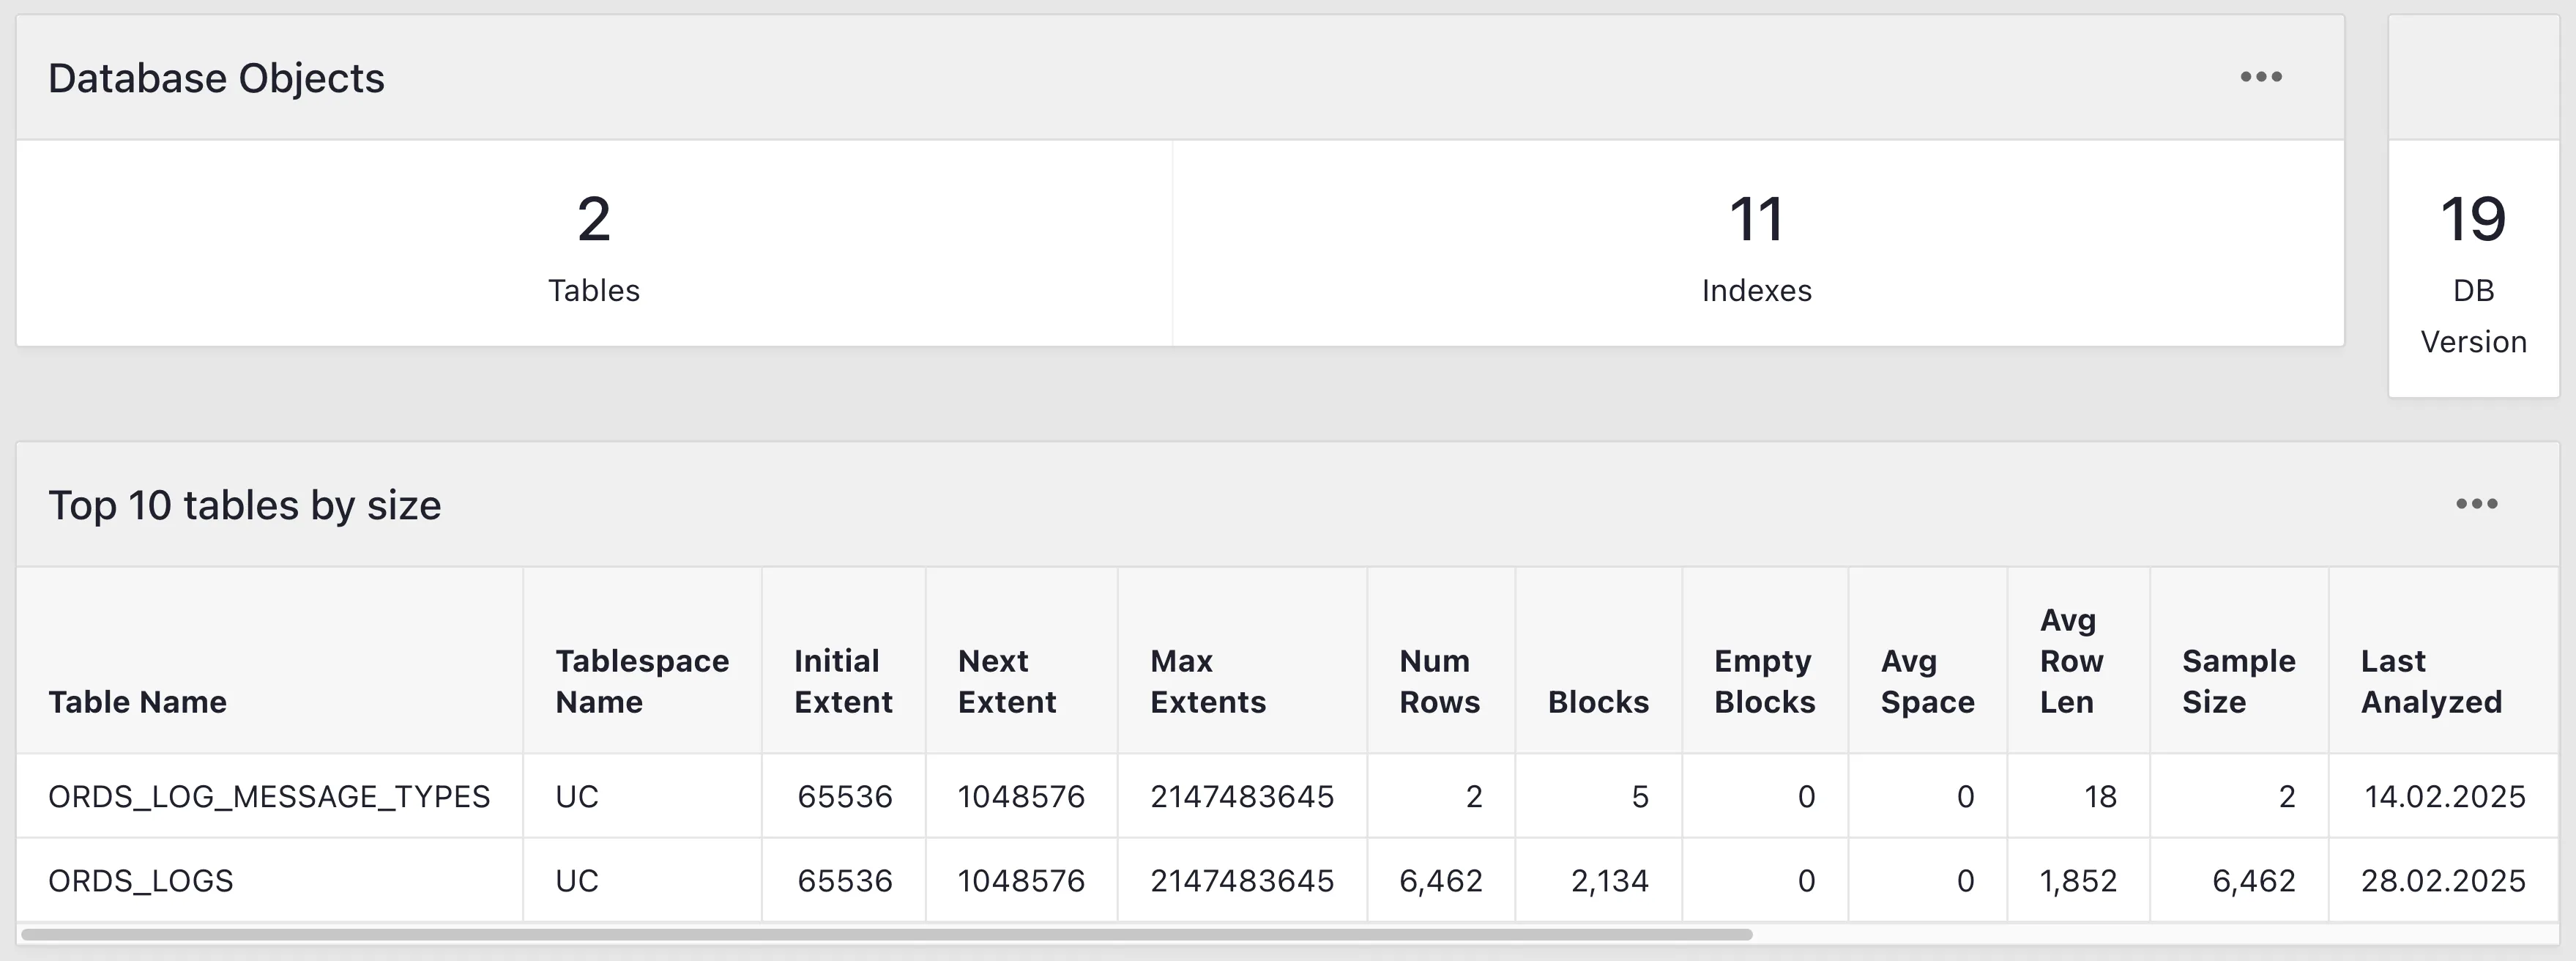
Information about database objects and large tables
Application Dashboard
Section titled “Application Dashboard”Gain insights into how your applications are being utilized:
- Usage Patterns: Identify peak usage times and usage distribution
- Page usage: Track which features users actually engage with
- Performance Metrics: Analyze performance data to identify bottlenecks
- Error Detials: Monitor errors and their impact on users
- Mail Statistics: Track email activity related to your applications
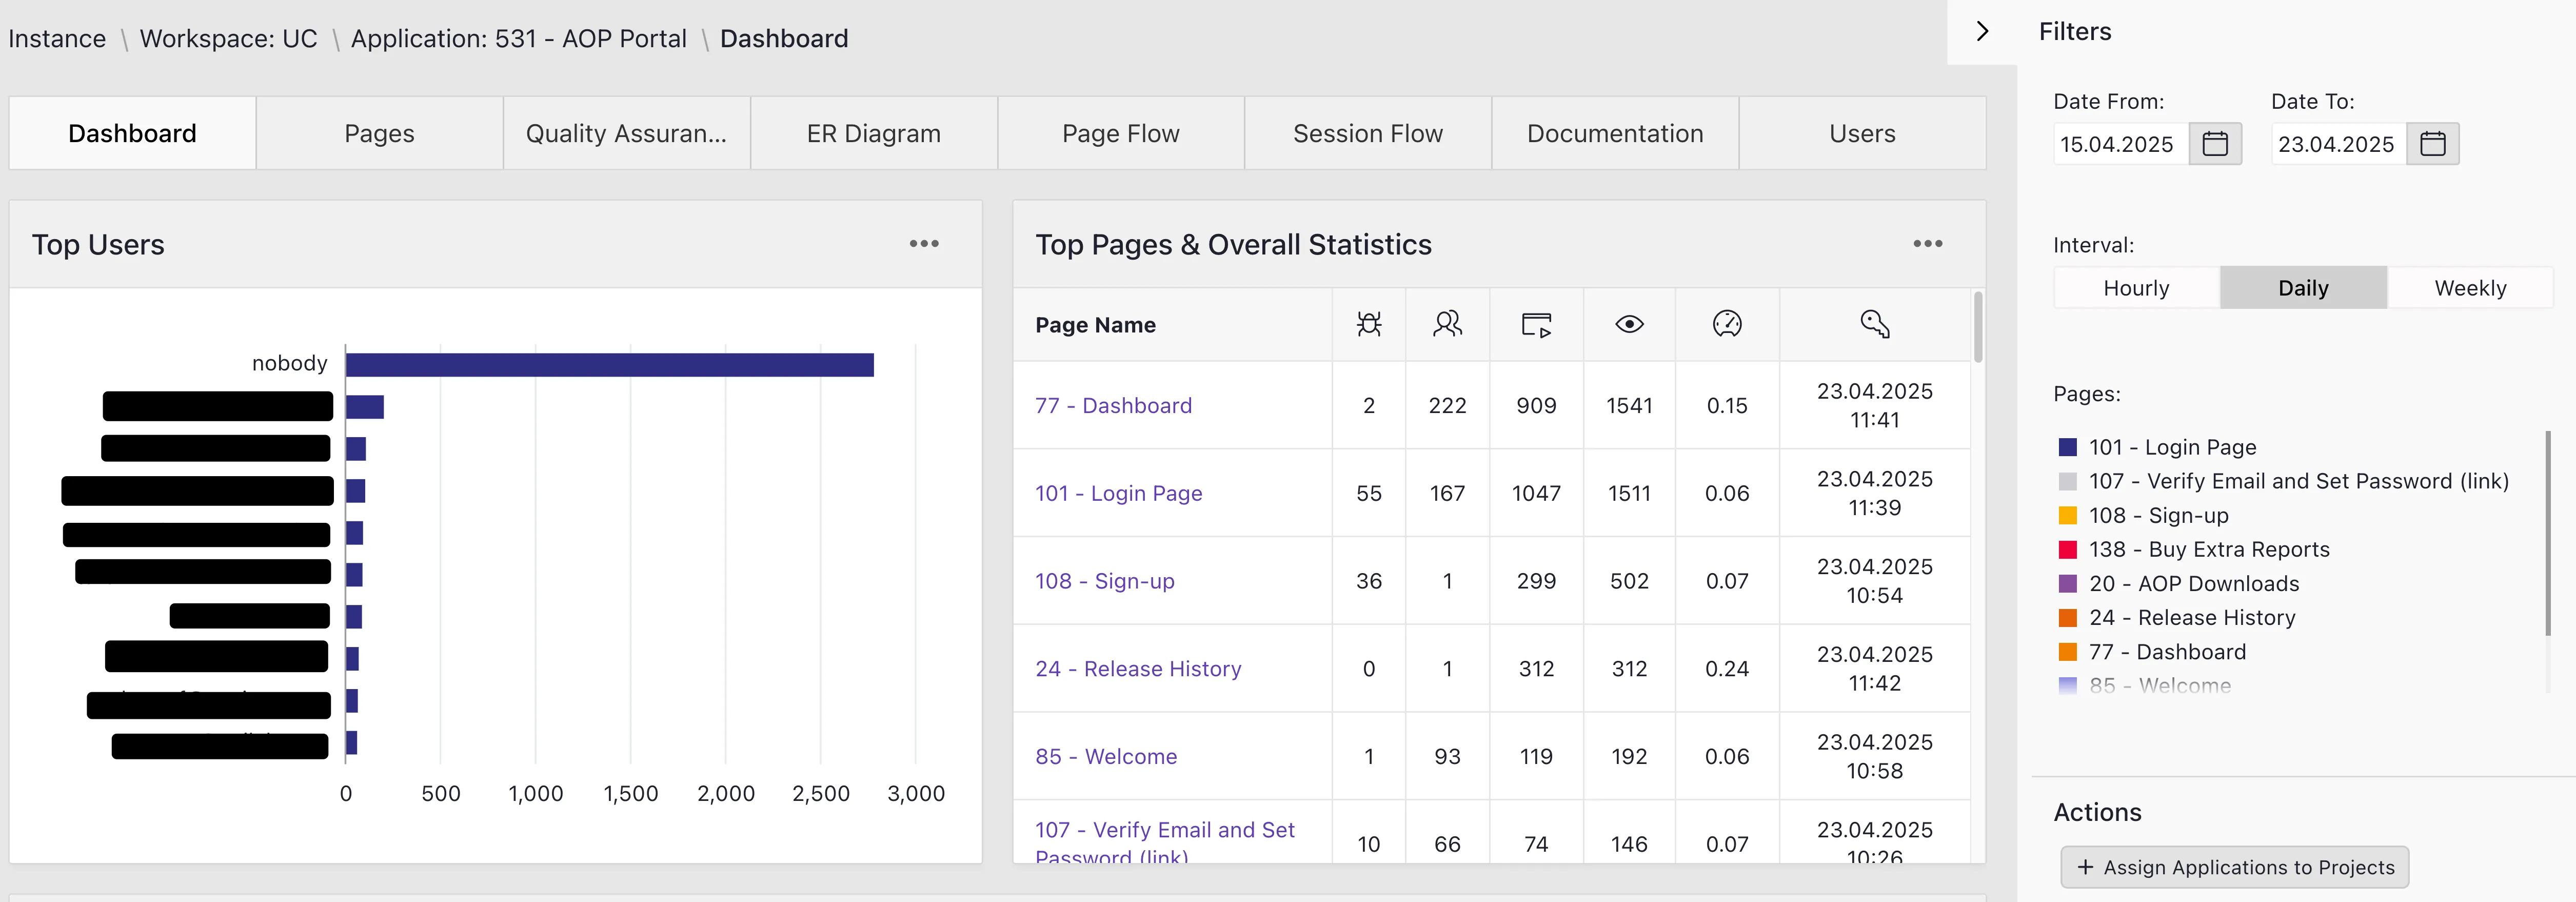
Top users and application stats
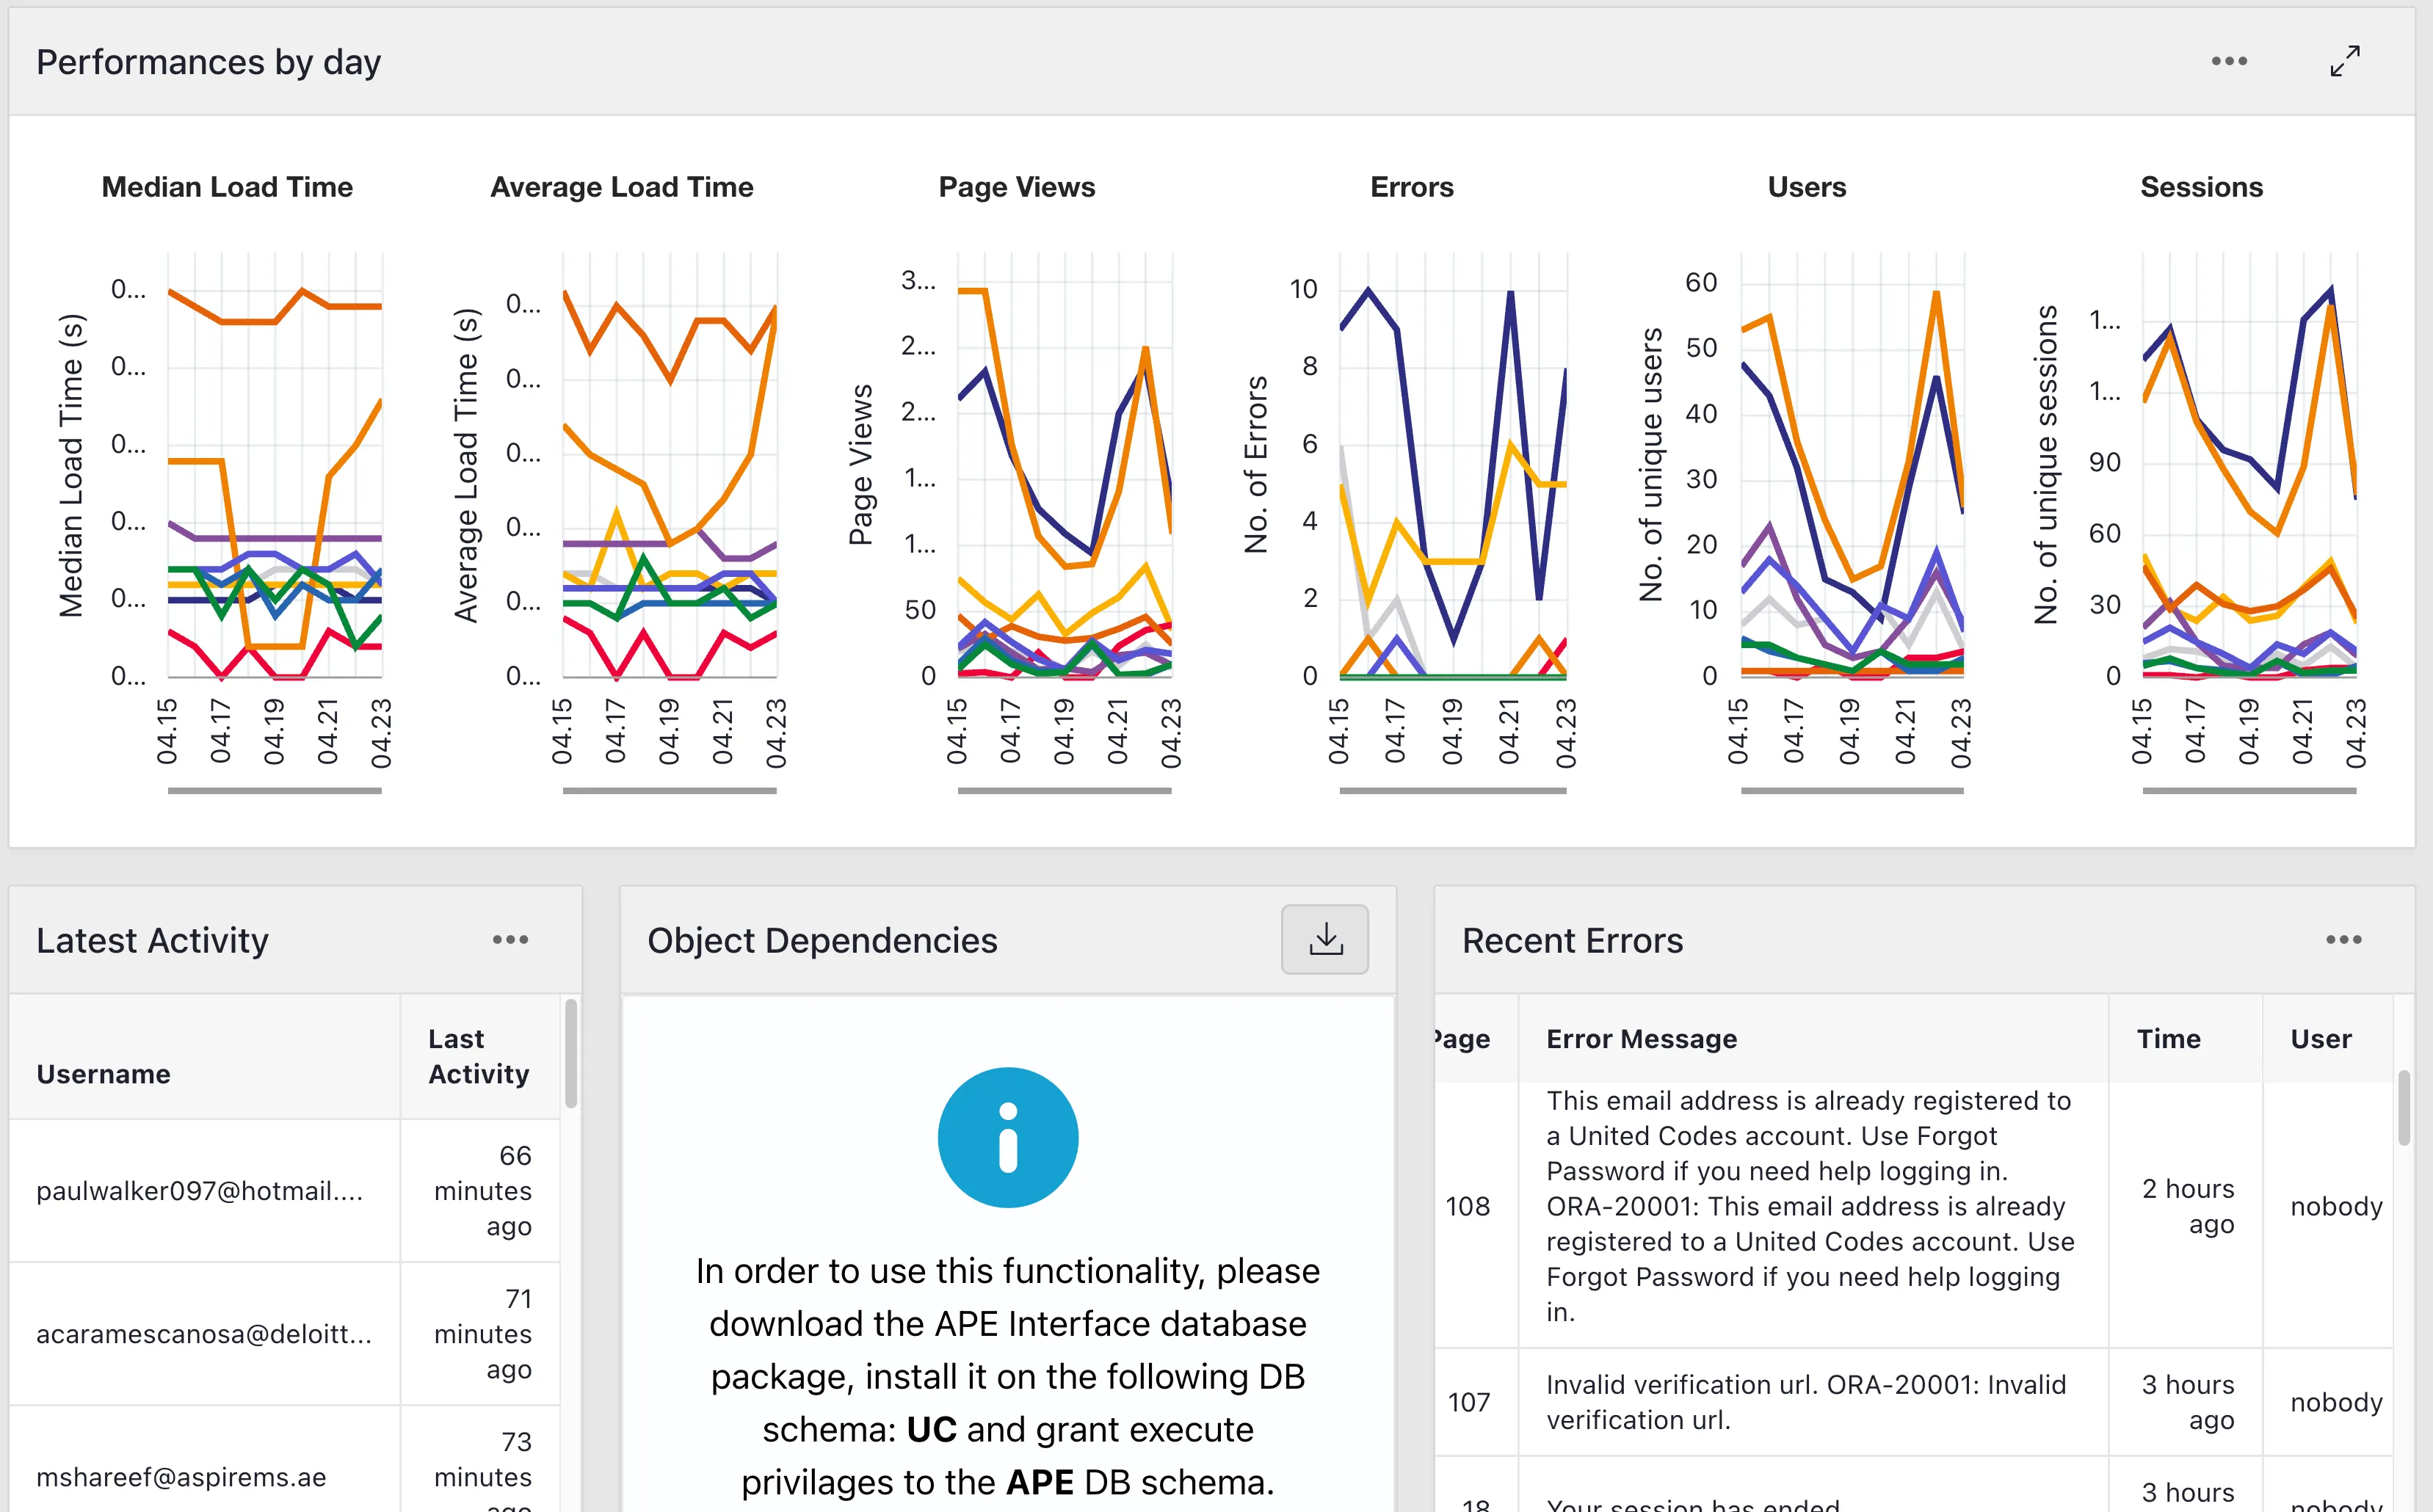
Performance metrics, user activity, and errors
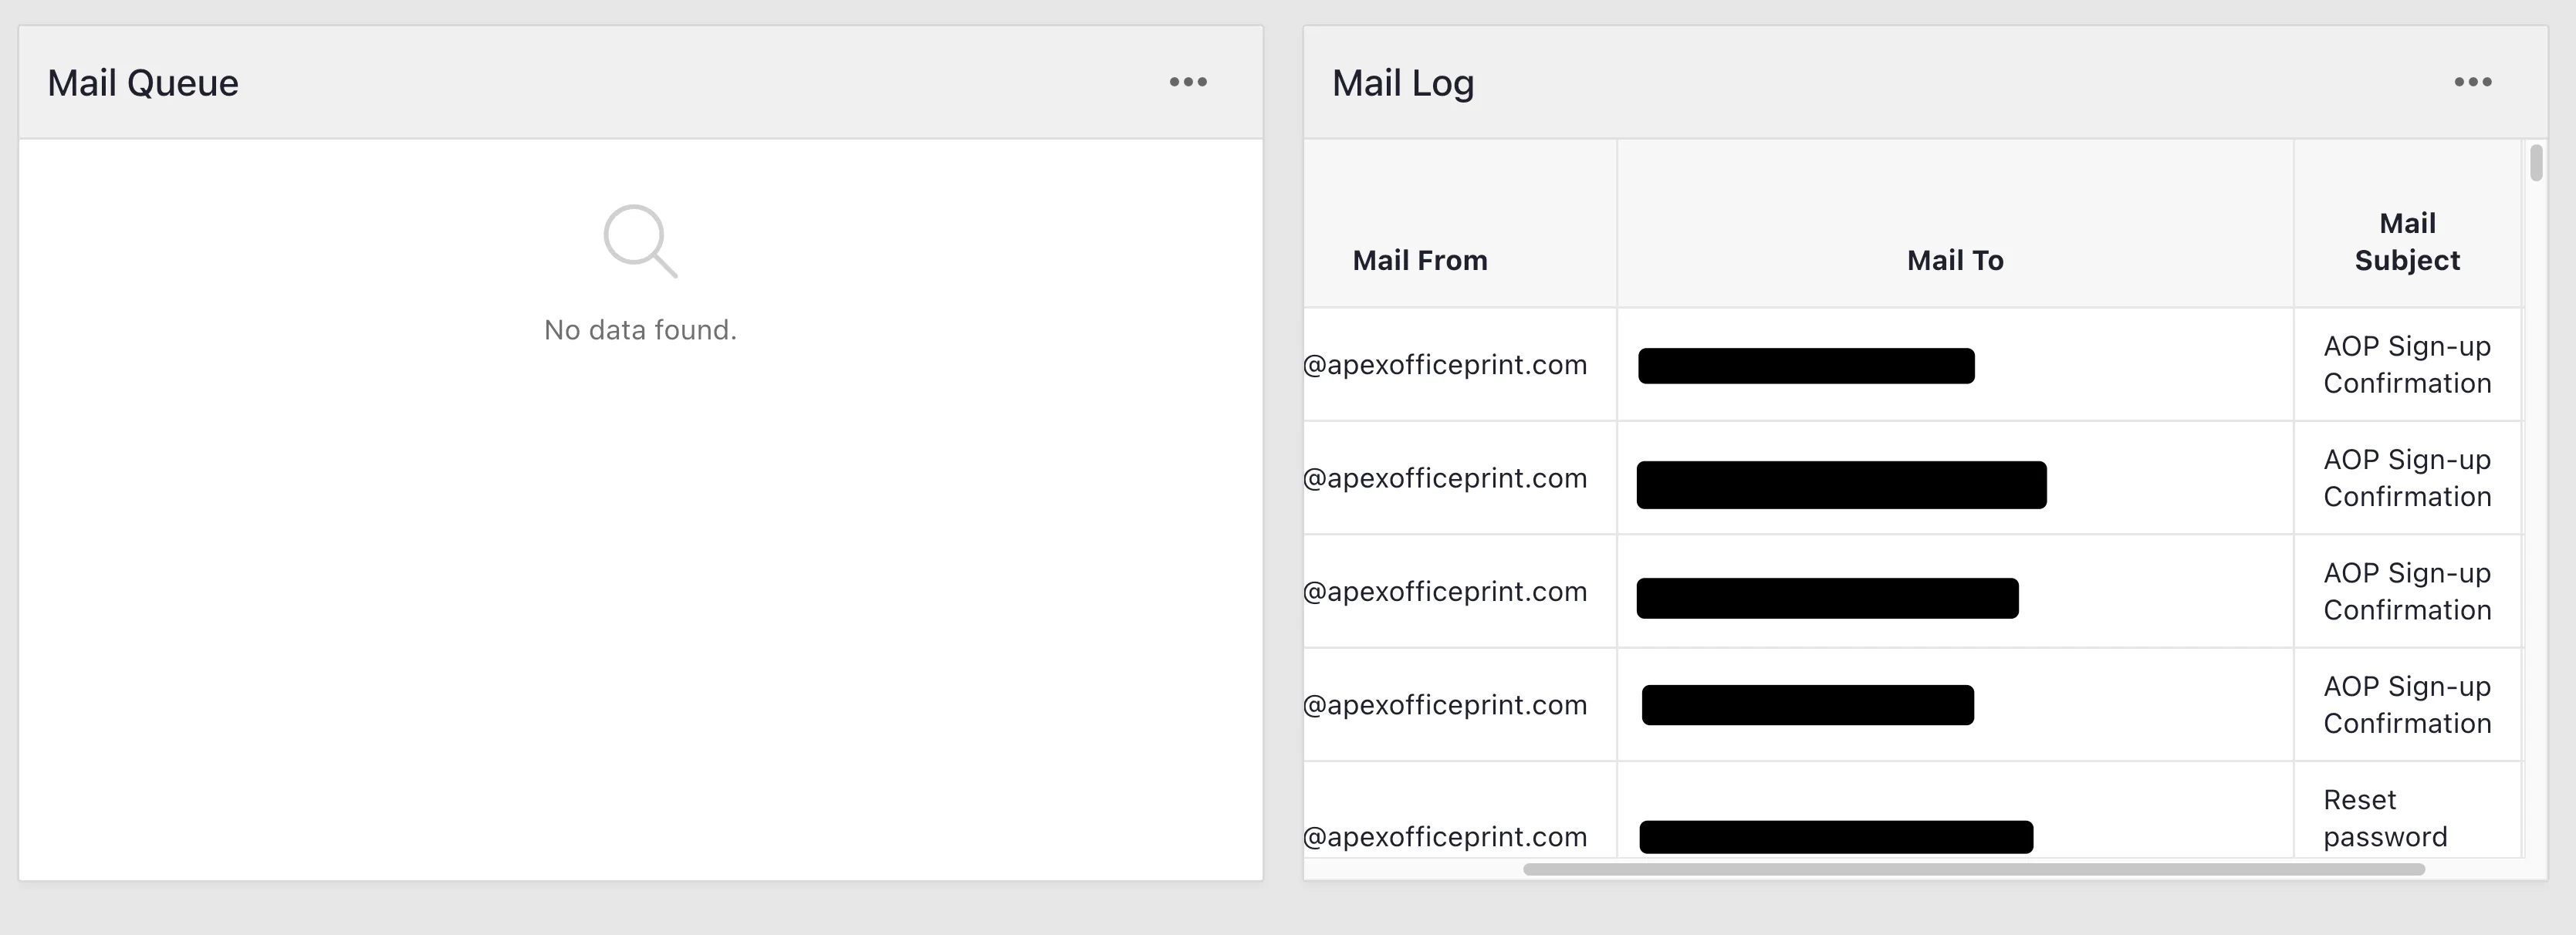
Mail log
Page Dashboard
Section titled “Page Dashboard”Get detailed insights into individual pages:
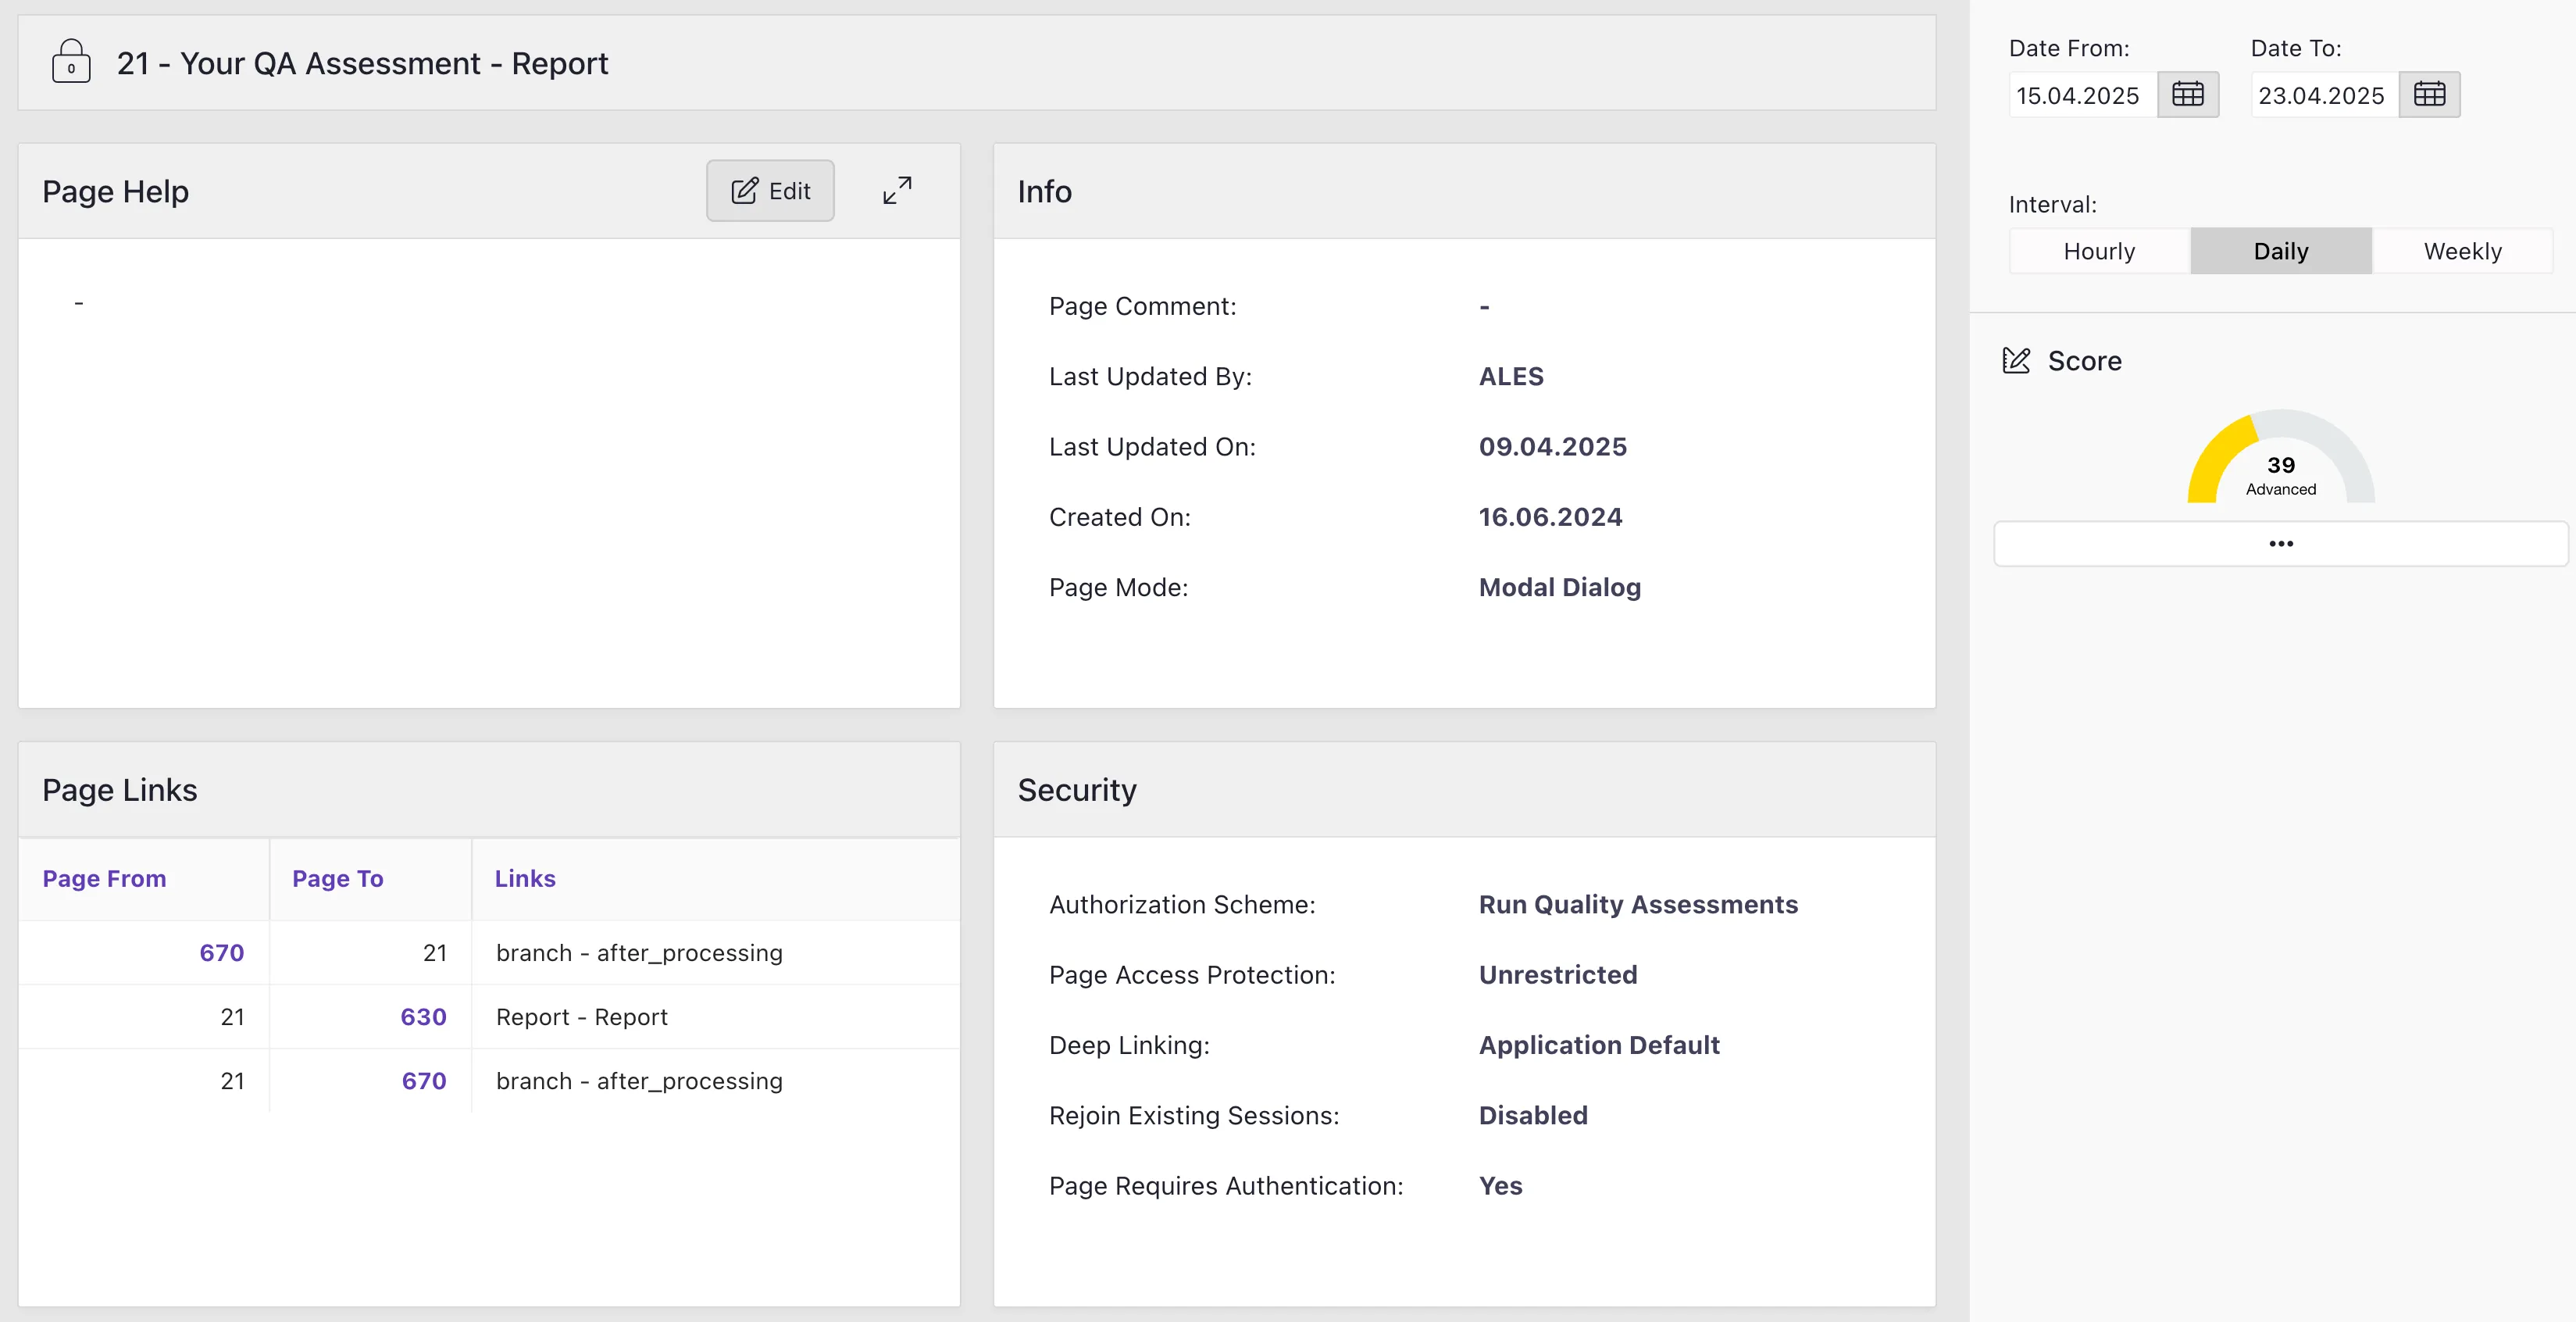
Page help, details, links and security
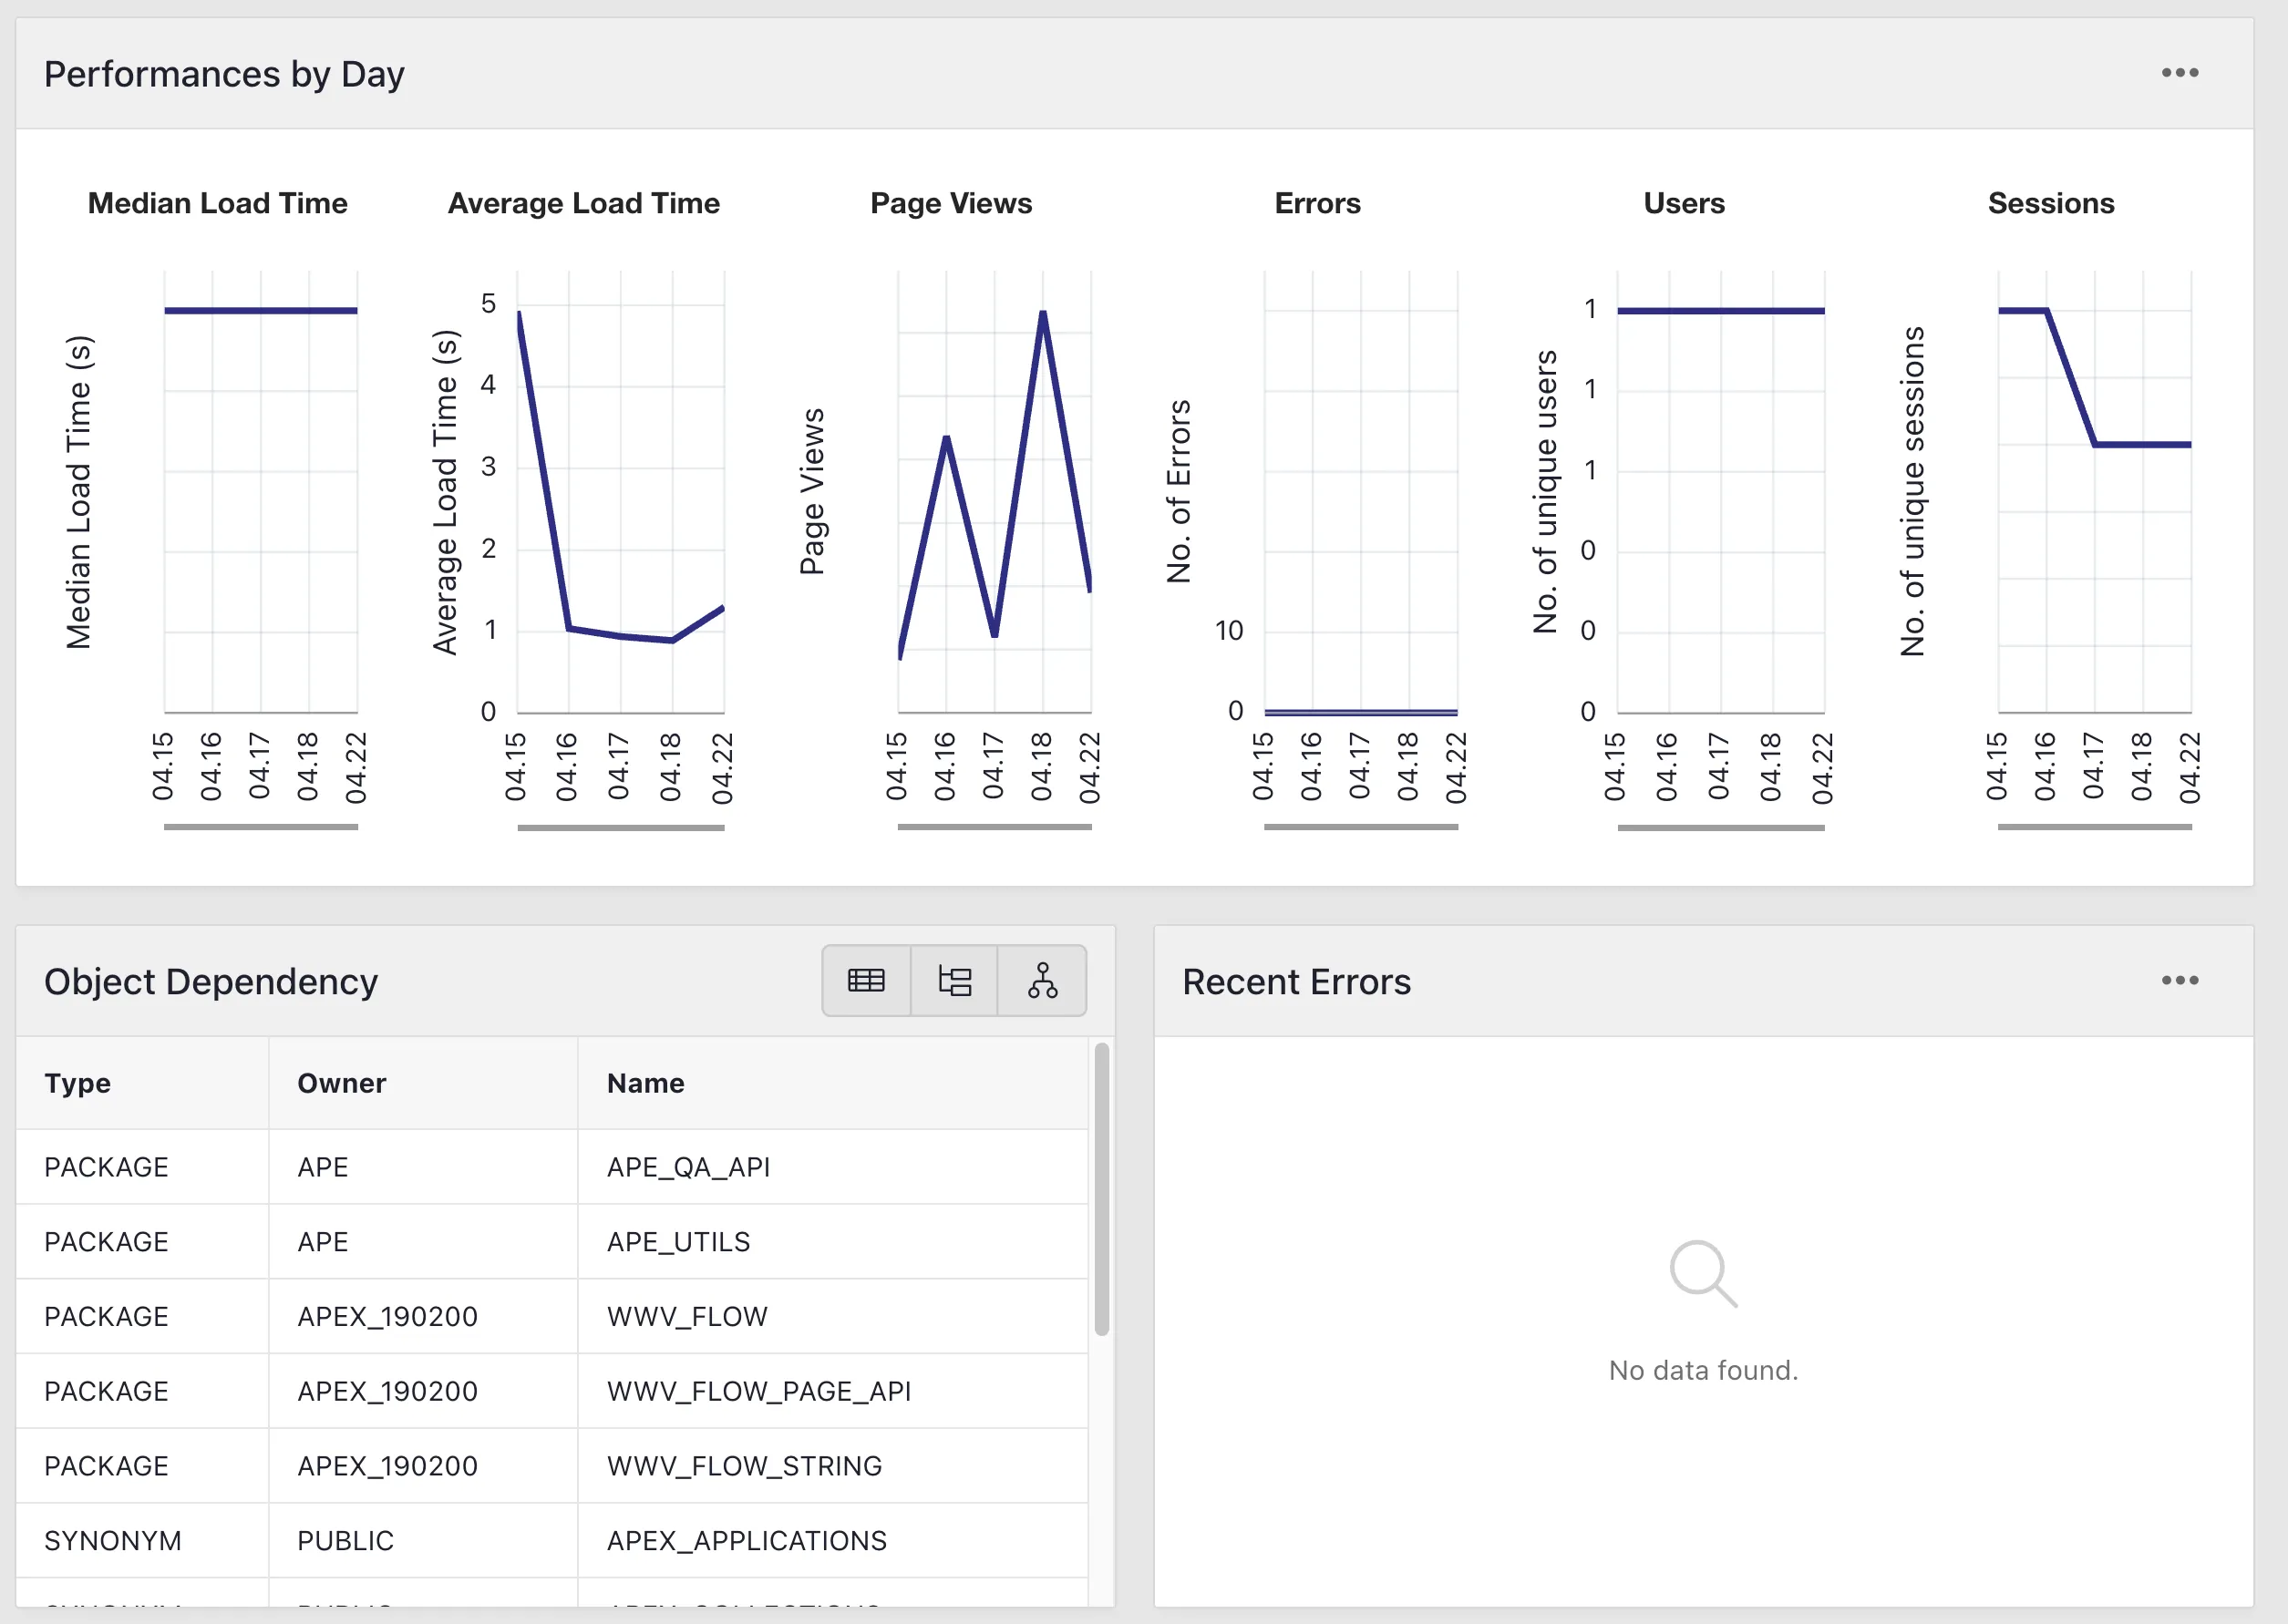
Performance, object dependencies, and recent errors
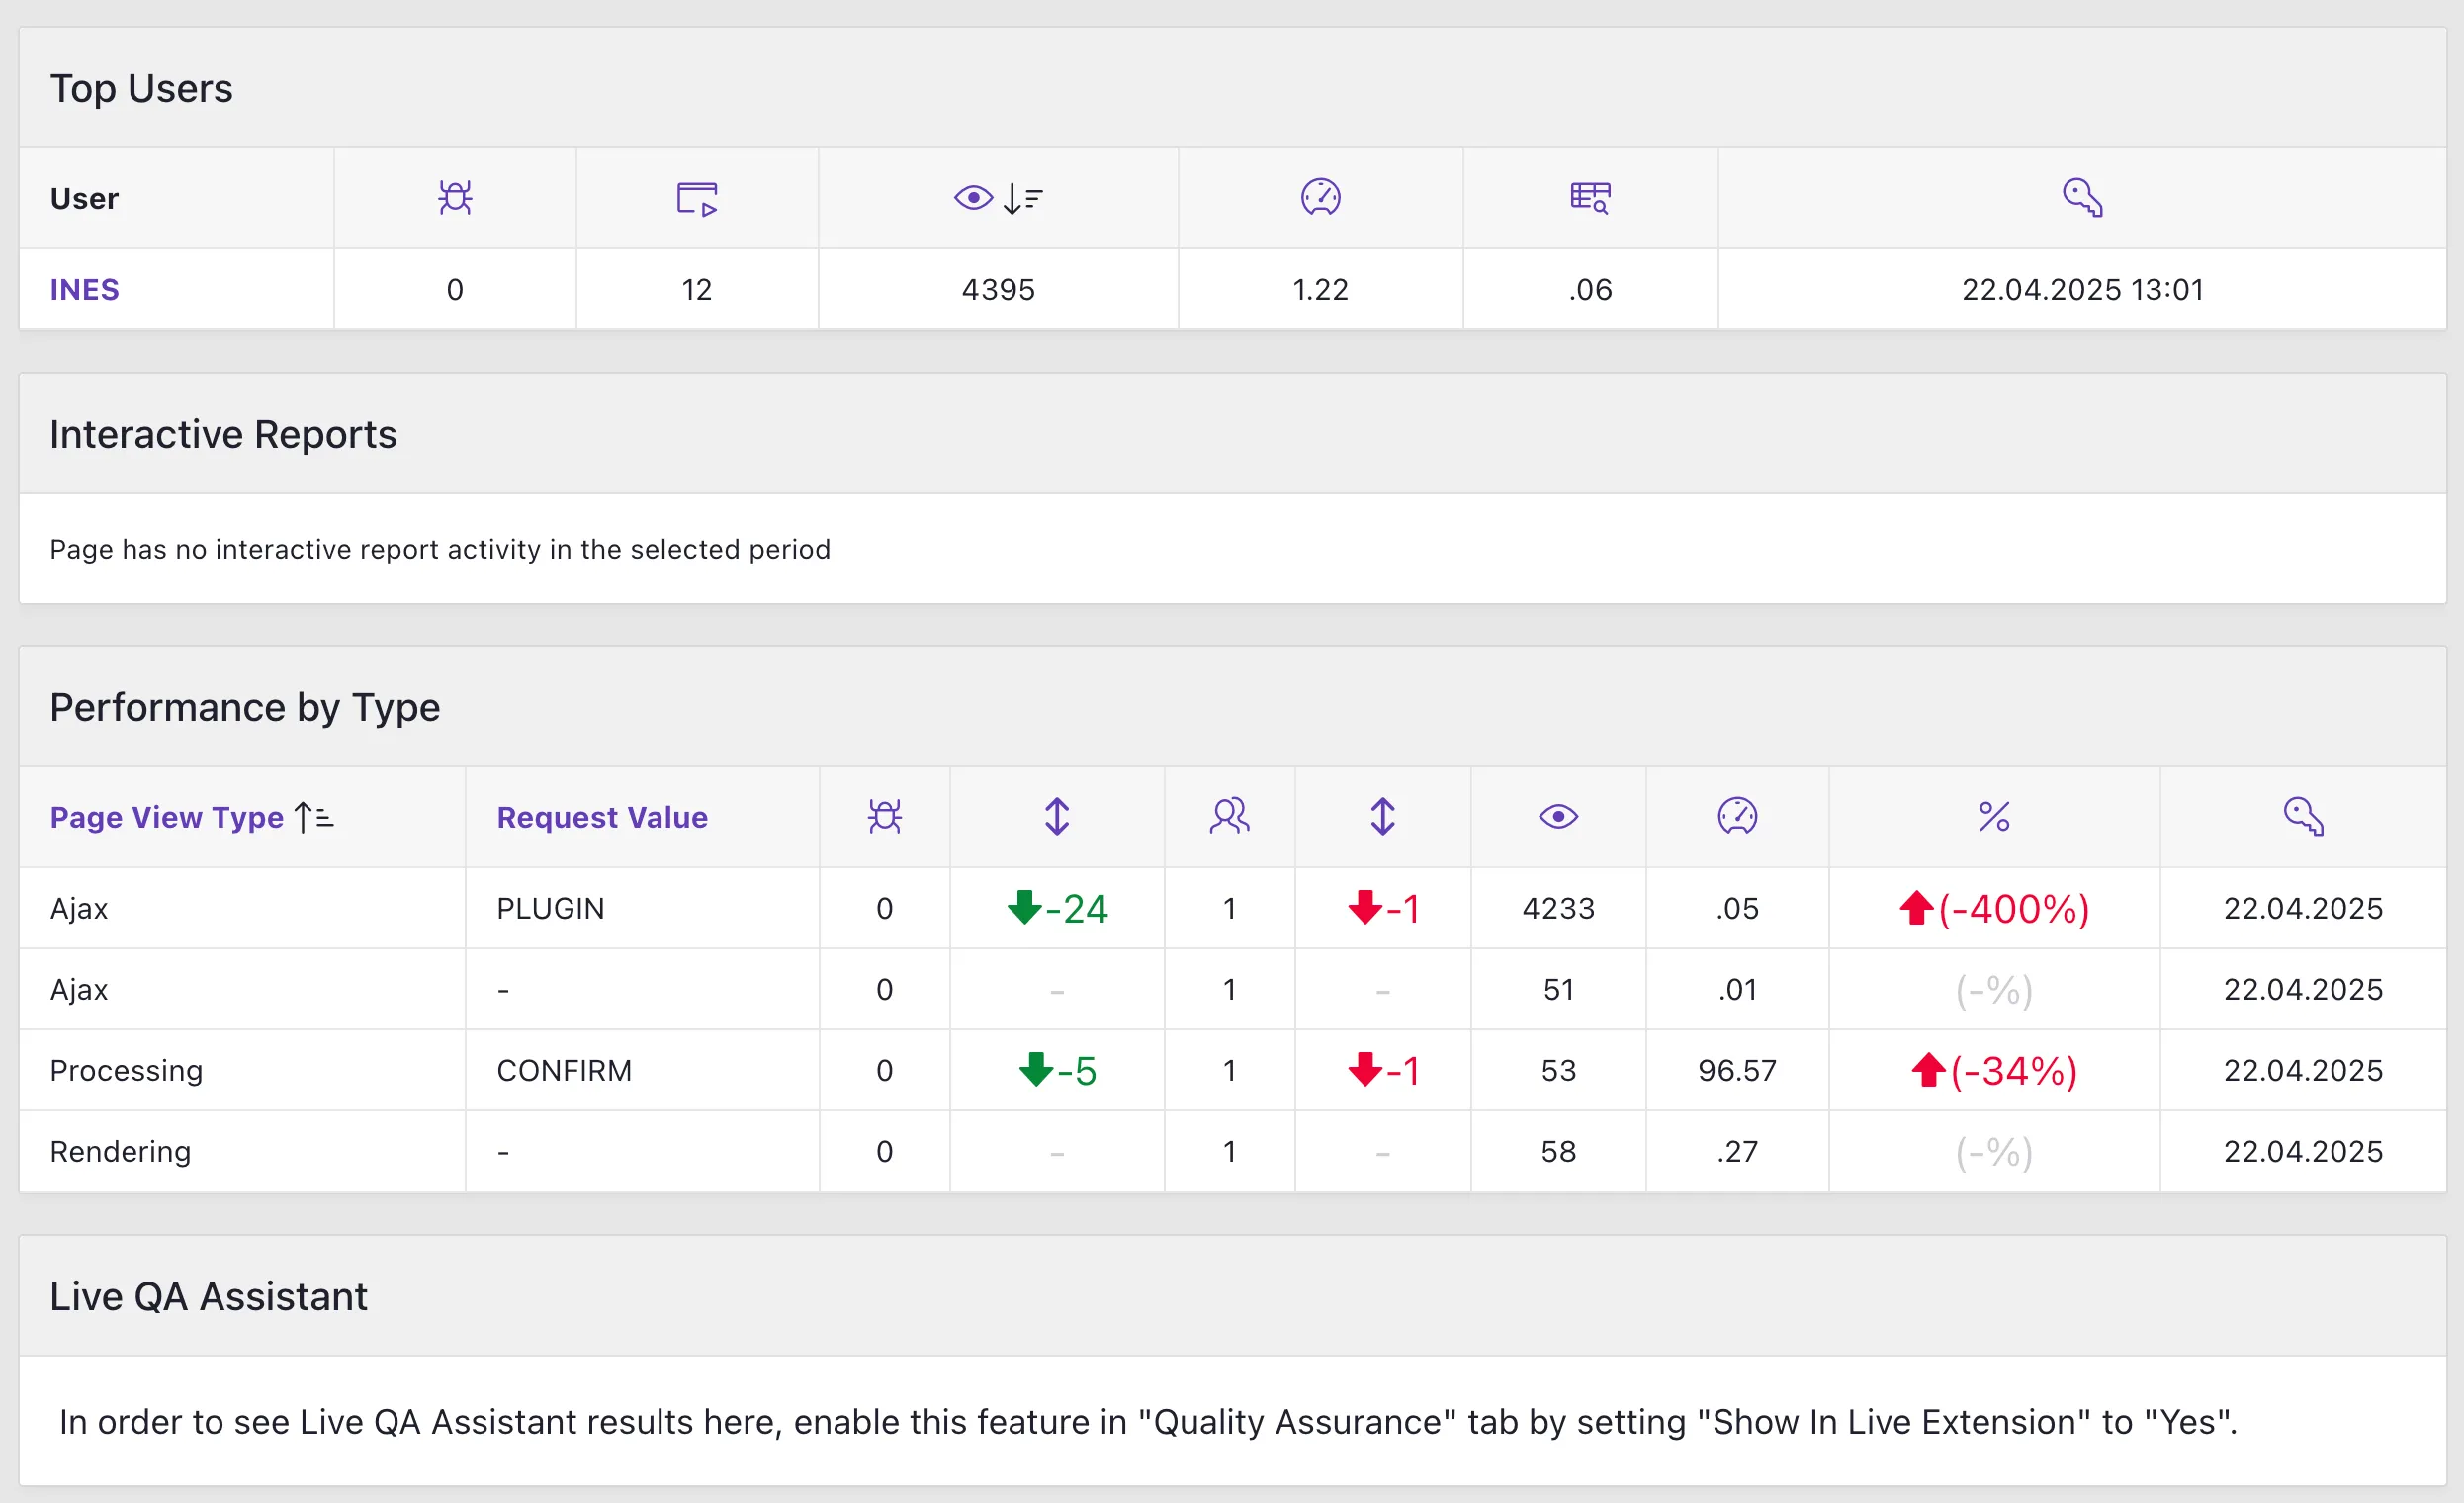
Top users, interactive reports, and performance by type
Detailed Activity Reports
Section titled “Detailed Activity Reports”On instance, workspace, application, and page levels, APEX Project Eye gives you detailed reports on user activity:
- User Activity: View detailed reports on individual user activity
- Page Access: See which pages are used most frequently
- Session Analysis: Analyze session duration, frequency, and patterns
- Error Tracking: Identify errors and their impact on users
- Time-based Reports: View activity by hour, day, week, or month
Performance Monitoring
Section titled “Performance Monitoring”APE gives you insights into application performance:
- Page Performance: Monitor page load times and processing delays
- Performance Trends: Track changes in performance over time
- User Impact: See how performance affects user activity
- Resource Utilization: Identify resource-intensive pages and processes
- Optimization Opportunities: Pinpoint areas that would benefit from performance tuning
Error Analysis
Section titled “Error Analysis”Identify and address Oracle APEX application errors:
- Error Tracking: Monitor errors across all applications
- Error Details: Access comprehensive information about each error like message, stack trace, and affected users
- Error Trends: Track changes in error frequency over time
- Session Replay: Replay user sessions to reproduce and diagnose problems
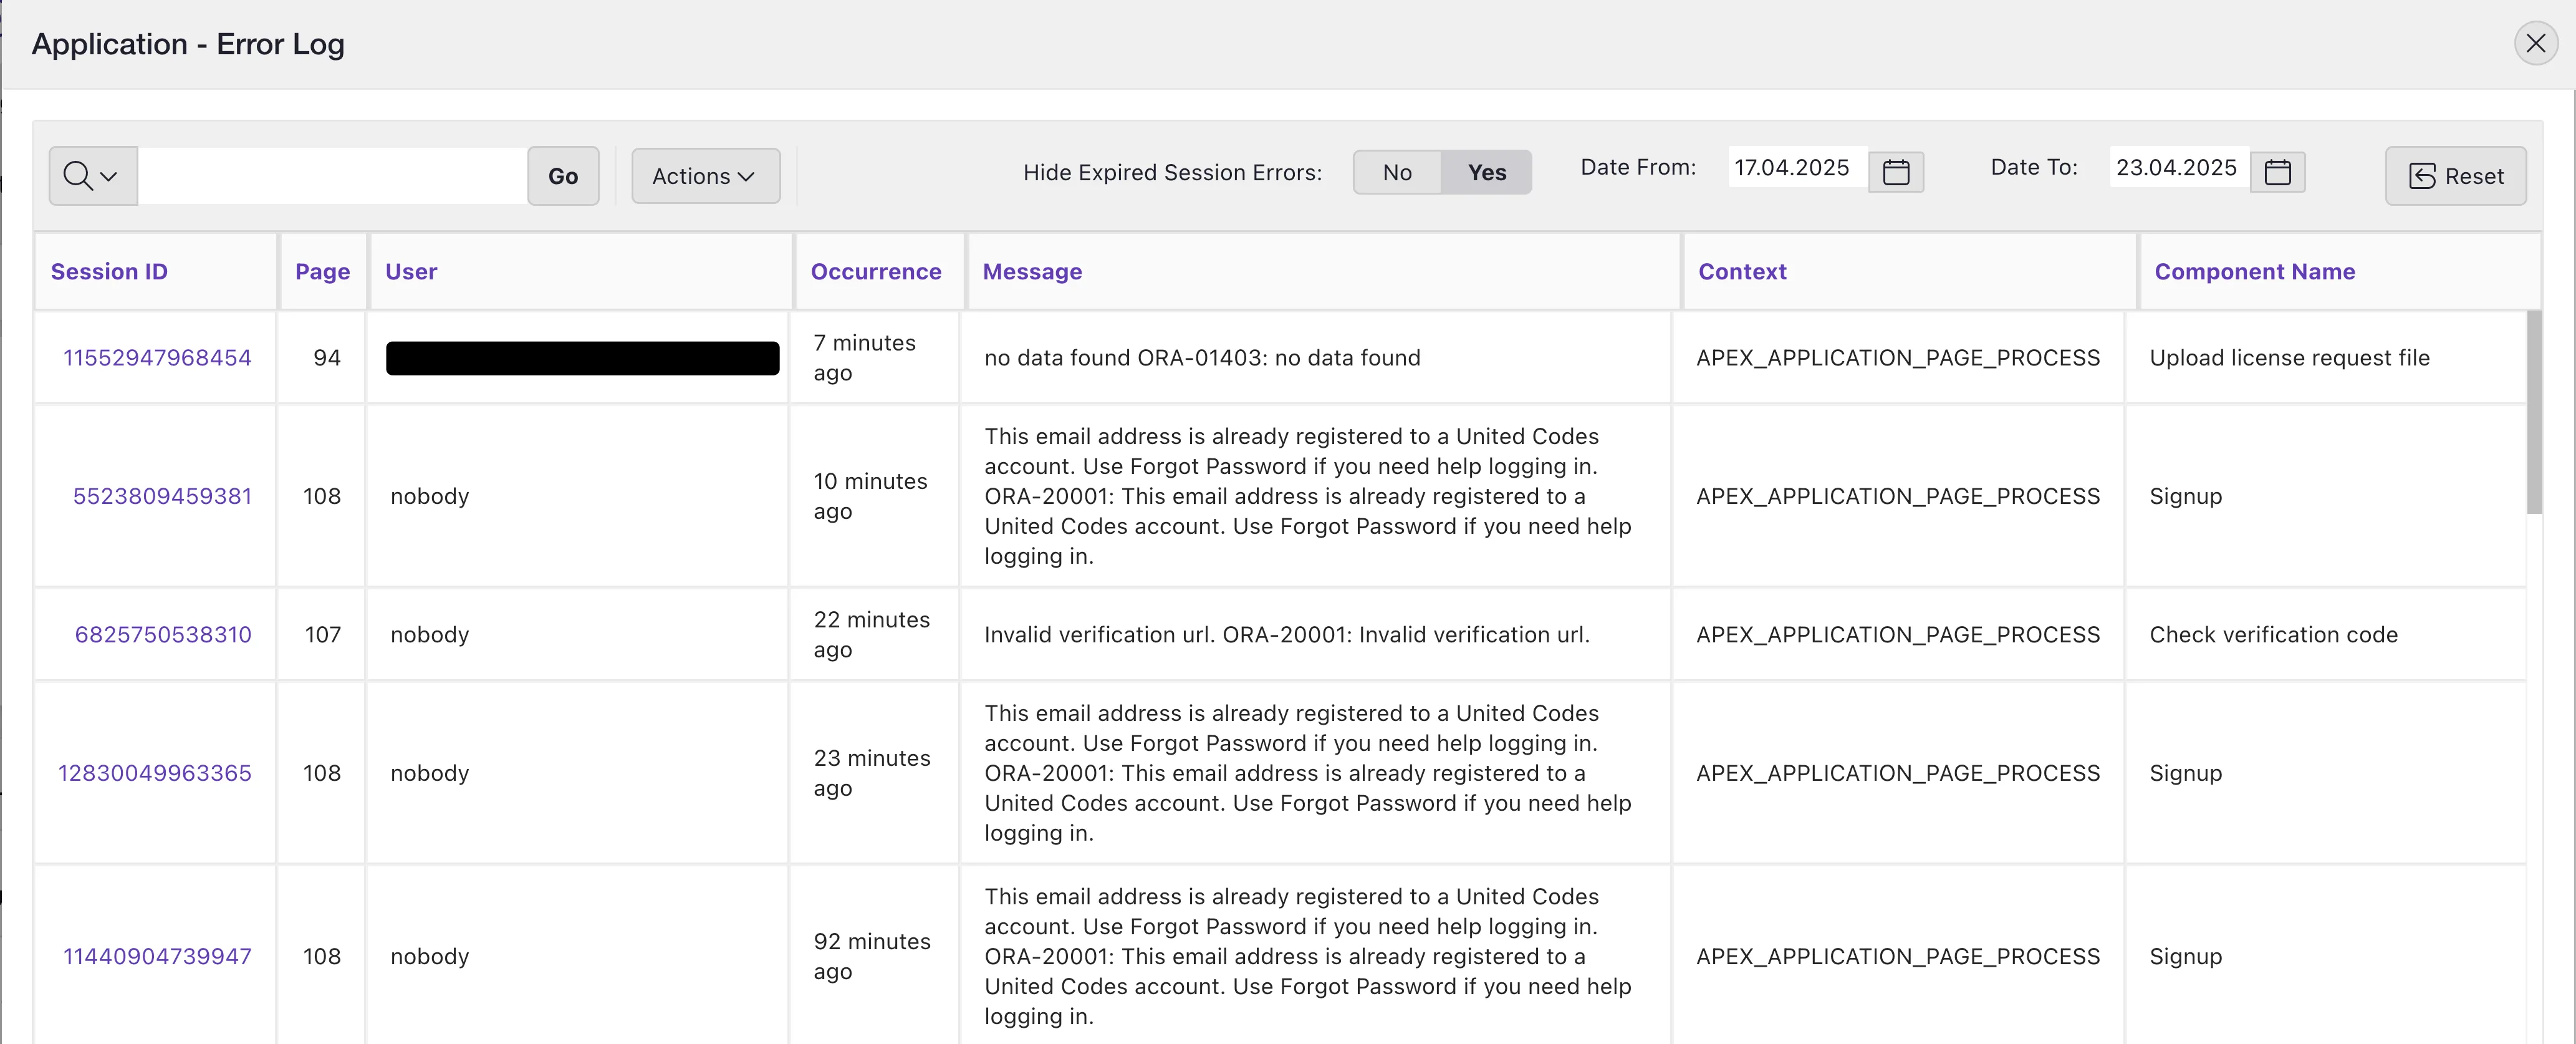
Comprehensive error analysis helps you identify and address issues
Related APE Features
Section titled “Related APE Features”- Session Flow: Replay user sessions to diagnose issues
- Watchtower: Set up monitoring for application performance and errors
- DB and ORDS Dashboard: Monitor database aspects alongside application activity
- Scorecard: Correlate application complexity with usage patterns